Nokia 2005 Annual Report Download - page 109
Download and view the complete annual report
Please find page 109 of the 2005 Nokia annual report below. You can navigate through the pages in the report by either clicking on the pages listed below, or by using the keyword search tool below to find specific information within the annual report.-
 1
1 -
2
-
3
-
4
-
5
-
6
-
7
-
8
-
9
-
10
-
11
-
12
-
13
-
14
-
15
-
16
-
17
-
18
-
19
-
20
-
21
-
22
-
23
-
24
-
25
-
26
-
27
-
28
-
29
-
30
-
31
-
32
-
33
-
34
-
35
-
36
-
37
-
38
-
39
-
40
-
41
-
42
-
43
-
44
-
45
-
46
-
47
-
48
-
49
-
50
-
51
-
52
-
53
-
54
-
55
-
56
-
57
-
58
-
59
-
60
-
61
-
62
-
63
-
64
-
65
-
66
-
67
-
68
-
69
-
70
-
71
-
72
-
73
-
74
-
75
-
76
-
77
-
78
-
79
-
80
-
81
-
82
-
83
-
84
-
85
-
86
-
87
-
88
-
89
-
90
-
91
-
92
-
93
-
94
-
95
-
96
-
97
-
98
-
 99
99 -
 100
100 -
 101
101 -
 102
102 -
 103
103 -
 104
104 -
 105
105 -
 106
106 -
 107
107 -
 108
108 -
 109
109 -
 110
110 -
 111
111 -
 112
112 -
 113
113 -
 114
114 -
 115
115 -
 116
116 -
 117
117 -
 118
118 -
 119
119 -
120
-
121
-
122
-
123
-
124
-
125
-
126
-
127
-
128
-
129
-
130
-
131
-
132
-
133
-
134
-
135
-
136
-
137
-
138
-
139
-
140
-
141
-
142
-
143
-
144
-
145
-
146
-
147
-
148
-
149
-
150
-
151
-
152
-
153
-
154
-
155
-
156
-
157
-
158
-
159
-
160
-
161
-
162
-
163
-
164
-
165
-
166
-
167
-
168
-
169
-
170
-
171
-
172
-
173
-
174
-
175
-
176
-
177
-
178
-
179
-
180
-
181
-
182
-
183
-
184
-
185
-
186
-
187
-
188
-
189
-
190
-
191
-
192
-
193
-
194
-
195
-
196
-
197
-
198
-
199
-
200
-
201
-
202
-
203
-
204
-
205
-
206
-
207
-
208
-
209
-
210
-
211
-
212
-
213
-
214
-
215
-
216
-
217
-
218
-
219
-
220
-
221
-
222
-
223
-
224
-
225
-
226
-
227
 |
 |

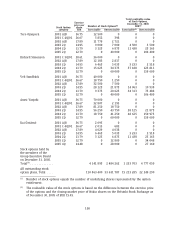
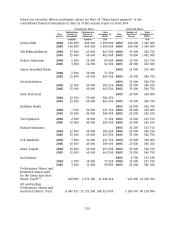
Stock option ownership of the Group Executive Board, December 31, 2005
Total realisable value
of Stock Options,
Exercise December 31, 2005
price per Number of Stock Options(1) EUR(2)
Stock Option share
category EUR Exercisable Unexercisable Exercisable(3) Unexercisable
Jorma Ollila 2001 A/B 36.75 1 000 000 0 0 0
2001 C 4Q/01 26.67 468 750 31 250 0 0
2002 A/B 17.89 812 500 187 500 0 0
2003 2Q 14.95 450 000 350 000 225 000 175 000
2004 2Q 11.79 125 000 275 000 457 500 1 006 500
2005 2Q 12.79 0 400 000 0 1 064 000
Olli-Pekka Kallasvuo 2001 A/B 36.75 100 000 0 0 0
2001 C 4Q/01 26.67 46 875 3 125 0 0
2002 A/B 17.89 142 183 32 817 0 0
2003 2Q 14.95 67 500 52 500 33 750 26 250
2004 2Q 11.79 18 750 41 250 68 625 150 975
2005 2Q 12.79 0 60 000 0 159 600
2005 4Q 14.48 0 100 000 0 97 000
Robert Andersson 2001 A/B 36.75 21 500 0 0 0
2001 C 4Q/01 26.67 10 068 682 0 0
2002 A/B 17.89 24 375 5 625 0 0
2003 2Q 14.95 10 125 7 875 5 063 3 938
2004 2Q 11.79 3 250 7 150 11 895 26 169
2005 2Q 12.79 0 12 000 0 31 920
2005 4Q 14.48 0 28 000 0 27 160
Simon Beresford-Wylie 2001 A/B 36.75 14 000 0 0 0
2001 C 4Q/01 26.67 6 557 443 0 0
2002 A/B 17.89 11 375 2 625 0 0
2003 2Q 14.95 7 310 5 690 3 655 2 845
2004 2Q 11.79 3 125 6 875 11 438 25 163
2005 2Q 12.79 0 60 000 0 159 600
Pertti Korhonen 2001 A/B 36.75 30 000 0 0 0
2001 C 4Q/01 26.67 14 057 943 0 0
2002 A/B 17.89 56 875 13 125 0 0
2003 2Q 14.95 28 125 21 875 14 063 10 938
2004 2Q 11.79 15 625 34 375 57 188 125 813
2005 2Q 12.79 0 60 000 0 159 600
Mary McDowell 2003 4Q 15.05 30 625 39 375 12 250 15 750
2004 2Q 11.79 15 625 34 375 57 188 125 813
2005 2Q 12.79 0 60 000 0 159 600
Hallstein Moerk 2001 A/B 36.75 30 000 0 0 0
2001 C 4Q/01 26.67 14 057 943 0 0
2002 A/B 17.89 24 375 5 625 0 0
2003 2Q 14.95 11 250 8 750 5 625 4 375
2004 2Q 11.79 9 375 20 625 34 313 75 488
2005 2Q 12.79 0 40 000 0 106 400
107