Nokia 2005 Annual Report Download - page 63
Download and view the complete annual report
Please find page 63 of the 2005 Nokia annual report below. You can navigate through the pages in the report by either clicking on the pages listed below, or by using the keyword search tool below to find specific information within the annual report.-
 1
1 -
2
-
3
-
4
-
5
-
6
-
7
-
8
-
9
-
10
-
11
-
12
-
13
-
14
-
15
-
16
-
17
-
18
-
19
-
20
-
21
-
22
-
23
-
24
-
25
-
26
-
27
-
28
-
29
-
30
-
31
-
32
-
33
-
34
-
35
-
36
-
37
-
38
-
39
-
40
-
41
-
42
-
43
-
44
-
45
-
46
-
47
-
48
-
49
-
50
-
51
-
52
-
 53
53 -
 54
54 -
 55
55 -
 56
56 -
 57
57 -
 58
58 -
 59
59 -
 60
60 -
 61
61 -
 62
62 -
 63
63 -
 64
64 -
 65
65 -
 66
66 -
 67
67 -
 68
68 -
 69
69 -
 70
70 -
 71
71 -
 72
72 -
 73
73 -
74
-
75
-
76
-
77
-
78
-
79
-
80
-
81
-
82
-
83
-
84
-
85
-
86
-
87
-
88
-
89
-
90
-
91
-
92
-
93
-
94
-
95
-
96
-
97
-
98
-
99
-
100
-
101
-
102
-
103
-
104
-
105
-
106
-
107
-
108
-
109
-
110
-
111
-
112
-
113
-
114
-
115
-
116
-
117
-
118
-
119
-
120
-
121
-
122
-
123
-
124
-
125
-
126
-
127
-
128
-
129
-
130
-
131
-
132
-
133
-
134
-
135
-
136
-
137
-
138
-
139
-
140
-
141
-
142
-
143
-
144
-
145
-
146
-
147
-
148
-
149
-
150
-
151
-
152
-
153
-
154
-
155
-
156
-
157
-
158
-
159
-
160
-
161
-
162
-
163
-
164
-
165
-
166
-
167
-
168
-
169
-
170
-
171
-
172
-
173
-
174
-
175
-
176
-
177
-
178
-
179
-
180
-
181
-
182
-
183
-
184
-
185
-
186
-
187
-
188
-
189
-
190
-
191
-
192
-
193
-
194
-
195
-
196
-
197
-
198
-
199
-
200
-
201
-
202
-
203
-
204
-
205
-
206
-
207
-
208
-
209
-
210
-
211
-
212
-
213
-
214
-
215
-
216
-
217
-
218
-
219
-
220
-
221
-
222
-
223
-
224
-
225
-
226
-
227
 |
 |

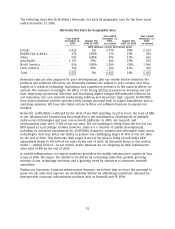
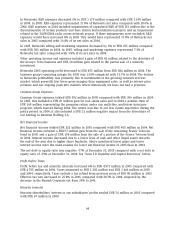
Mobile Phones business group 2005 net sales increased 12% to EUR 20 811 million compared with
EUR 18 521 million in 2004. At constant currency, Mobile Phones business group net sales would
have increased by 15%. Sales growth was strongest in China followed by Asia-Pacific, Europe and
Middle East & Africa. Net sales declined in North America and to a lesser extent in Latin America.
Net sales in 2005 increased as a result of strong demand for the Nokia 6230 mid range family,
including the Nokia 6230i (Nokia’s highest revenue generating phone in 2005), the entry level
Nokia 1100 family and the Nokia 2600. Volume growth was partially offset by declining ASPs.
Mobile Phones 2005 gross profit was EUR 6 480 million, virtually the same level as 2004. This
represented a gross margin of 31.1% in 2005 compared with a gross margin of 35.0% in 2004. This
decline reflected a higher proportion of sales of lower priced entry level phones, driven by strong
demand in emerging markets where our share is high.
Mobile Phones 2005 R&D expenses increased by 4% to EUR 1 245 million, with the target to bring
more new products to the market, compared with EUR 1 196 million in 2004. In 2005, R&D
expenses represented 6.0% of Mobile Phones net sales compared with 6.5% of its net sales in 2004.
In 2005, Mobile Phones selling and marketing expenses increased by 19% to EUR 1 541 million as a
result of higher investments in marketing and advertising in order to introduce more new
products, compared with EUR 1 300 million in 2004. In 2005, selling and marketing expenses
represented 7.4% of Mobile Phones net sales compared with 7.0% of its net sales in 2004.
In 2005, Mobile Phones operating profit decreased 5% to EUR 3 598 million compared with
EUR 3 786 million in 2004, with a 17.3% operating margin, down from 20.4% in 2004. This decline
reflected a higher proportion of sales of lower priced entry level phones, driven by strong demand
in emerging markets where our share is high, in addition to an increase in operating expenses as
explained above.
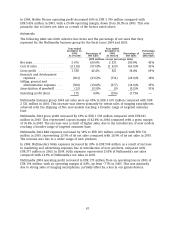
Multimedia
The following table sets forth selective line items and the percentage of net sales that they
represent for the Multimedia business group for the fiscal years 2005 and 2004.
Year ended
Year ended December 31, Percentage
December 31, Percentage of 2004 Percentage of Increase/
2005 Net Sales As revised Net Sales (decrease)
(EUR millions, except percentage data)
Net sales .................. 5 981 100% 3 676 100.0% 63%
Cost of sales ................ (3 492) (58.4)% (2 118) (57.6)% 65%
Gross profit ................ 2 489 41.6% 1 558 42.4% 60%
Research and development
expenses ................. (860) (14.4)% (863) (23.5)% —
Selling and marketing expenses (705) (11.8)% (488) (13.2)% 44%
Administrative and general
expenses ................. (38) (0.6)% (36) (1.0)% 6%
Other operating income and
expenses ................. (50) (0.8)% 16 0.4% —
Amortization of goodwill ..... — — (12) (0.3)% —
Operating profit ............. 836 14.0% 175 4.8% 378%
Multimedia business group 2005 net sales increased 63% to EUR 5 981 million compared with
EUR 3 676 million in 2004. At constant currency, Multimedia net sales would have increased 69%
in 2005. Strong sales were supported by high demand for 3G/WCDMA devices such as the Nokia
61