Nokia 2005 Annual Report Download - page 74
Download and view the complete annual report
Please find page 74 of the 2005 Nokia annual report below. You can navigate through the pages in the report by either clicking on the pages listed below, or by using the keyword search tool below to find specific information within the annual report.-
 1
1 -
2
-
3
-
4
-
5
-
6
-
7
-
8
-
9
-
10
-
11
-
12
-
13
-
14
-
15
-
16
-
17
-
18
-
19
-
20
-
21
-
22
-
23
-
24
-
25
-
26
-
27
-
28
-
29
-
30
-
31
-
32
-
33
-
34
-
35
-
36
-
37
-
38
-
39
-
40
-
41
-
42
-
43
-
44
-
45
-
46
-
47
-
48
-
49
-
50
-
51
-
52
-
53
-
54
-
55
-
56
-
57
-
58
-
59
-
60
-
61
-
62
-
63
-
 64
64 -
 65
65 -
 66
66 -
 67
67 -
 68
68 -
 69
69 -
 70
70 -
 71
71 -
 72
72 -
 73
73 -
 74
74 -
 75
75 -
 76
76 -
 77
77 -
 78
78 -
 79
79 -
 80
80 -
 81
81 -
 82
82 -
 83
83 -
 84
84 -
85
-
86
-
87
-
88
-
89
-
90
-
91
-
92
-
93
-
94
-
95
-
96
-
97
-
98
-
99
-
100
-
101
-
102
-
103
-
104
-
105
-
106
-
107
-
108
-
109
-
110
-
111
-
112
-
113
-
114
-
115
-
116
-
117
-
118
-
119
-
120
-
121
-
122
-
123
-
124
-
125
-
126
-
127
-
128
-
129
-
130
-
131
-
132
-
133
-
134
-
135
-
136
-
137
-
138
-
139
-
140
-
141
-
142
-
143
-
144
-
145
-
146
-
147
-
148
-
149
-
150
-
151
-
152
-
153
-
154
-
155
-
156
-
157
-
158
-
159
-
160
-
161
-
162
-
163
-
164
-
165
-
166
-
167
-
168
-
169
-
170
-
171
-
172
-
173
-
174
-
175
-
176
-
177
-
178
-
179
-
180
-
181
-
182
-
183
-
184
-
185
-
186
-
187
-
188
-
189
-
190
-
191
-
192
-
193
-
194
-
195
-
196
-
197
-
198
-
199
-
200
-
201
-
202
-
203
-
204
-
205
-
206
-
207
-
208
-
209
-
210
-
211
-
212
-
213
-
214
-
215
-
216
-
217
-
218
-
219
-
220
-
221
-
222
-
223
-
224
-
225
-
226
-
227
 |
 |
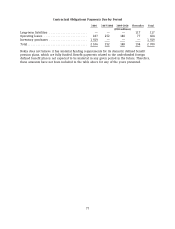
EUR 3 582 million in 2005 compared with EUR 3 343 million in 2004 and EUR 4 097 million in
2003.
The principal differences between IFRS and US GAAP that affect our net profit or loss, as well as
our shareholders’ equity, relate to the treatment of capitalization and impairment of development
costs, pension costs, provision for social security costs on share-based payments, share-based
compensation expense, identifiable intangible assets acquired, amortization and impairment of
goodwill, translation of goodwill, cash flow hedges and marketable securities and unlisted
investments. See Note 39 to our consolidated financial statements included in Item 18 of this
annual report on Form 20-F for a description of the principal differences between IFRS and
US GAAP and for a description of the anticipated impact on the consolidated financial statements
of the adoption of recently issued US GAAP accounting standards.
5.B Liquidity and Capital Resources
At December 31, 2005, Nokia’s cash and other liquid assets (bank and cash; available-for-sale
investments, cash equivalents; and available-for-sale investments, liquid assets) decreased to
EUR 9 910 million, compared with EUR 11 542 million at December 31, 2004, mainly due to an
increase in the purchases of treasury shares partly offset with the cash from investing activities.
Cash and cash equivalents increased to EUR 3 058 million compared with EUR 2 457 million at
December 31, 2004. We hold our cash and cash equivalents predominantly in euros. Cash and cash
equivalents totaled EUR 2 784 million at December 31, 2003.
Net cash from operating activities was EUR 4 144 million in 2005 compared with EUR 4 343 million
in 2004, and EUR 5 252 million in 2003. In 2005, net cash generated from operating activities
decreased primarily due to an increase in working capital. In 2004, net cash generated from
operating activities decreased primarily due to lower profit partly offset by a reduction in working
capital.
Net cash from investing activities in 2005 was EUR 1 844 million compared with net cash used in
investing activities of EUR 329 million in 2004, and EUR 3 215 million in 2003. Cash flow from
investing activities in 2005 included purchases of current available-for-sale investments, liquid
assets, of EUR 7 277 million, compared with EUR 10 318 million in 2004, and EUR 11 695 million
in 2003. Additions to capitalized R&D expenses totaled EUR 153 million, representing an increase
compared with EUR 101 million in 2004. In 2003, additions to capitalized R&D were EUR 218
million. Long-term loans made to customers increased to EUR 56 million in 2005, compared with
EUR 0 million in 2004 and EUR 97 million in 2003. Capital expenditures for 2005 were EUR 607
million compared with EUR 548 million in 2004 and EUR 432 million in 2003. Major items of
capital expenditure included production lines, test equipment and computer hardware used
primarily in research and development as well as office and manufacturing facilities. Proceeds
from maturities and sale of current available-for-sale investments, liquid assets, decreased to
EUR 9 402 million, compared with EUR 9 737 million in 2004, and EUR 8 793 million in 2003.
During 2005 we sold the remaining holdings in the subordinated convertible perpetual bonds
issued by France Telecom. As a result, we booked proceeds from sale of current available-for-sale
investments of EUR 247 million (EUR 587 million in 2004).
Net cash used in financing activities increased to EUR 5 570 million in 2005 compared with
EUR 4 318 million in 2004, primarily as a result of an increase in the purchases of treasury shares
with EUR 1 610 million during 2005. Net cash used in financing activities increased to EUR 4 318
million in 2004 compared with EUR 2 780 million in 2003, primarily as a result of an increase in
the purchases of treasury shares with EUR 1 293 million and an increase in the repayment of
short-term borrowings of EUR 233 million during 2004. Dividends paid increased to EUR 1 531
million in 2005 compared with EUR 1 413 million in 2004 and EUR 1 378 million in 2003.
72