Nokia 2005 Annual Report Download - page 52
Download and view the complete annual report
Please find page 52 of the 2005 Nokia annual report below. You can navigate through the pages in the report by either clicking on the pages listed below, or by using the keyword search tool below to find specific information within the annual report.-
 1
1 -
2
-
3
-
4
-
5
-
6
-
7
-
8
-
9
-
10
-
11
-
12
-
13
-
14
-
15
-
16
-
17
-
18
-
19
-
20
-
21
-
22
-
23
-
24
-
25
-
26
-
27
-
28
-
29
-
30
-
31
-
32
-
33
-
34
-
35
-
36
-
37
-
38
-
39
-
40
-
41
-
 42
42 -
 43
43 -
 44
44 -
 45
45 -
 46
46 -
 47
47 -
 48
48 -
 49
49 -
 50
50 -
 51
51 -
 52
52 -
 53
53 -
 54
54 -
 55
55 -
 56
56 -
 57
57 -
 58
58 -
 59
59 -
 60
60 -
 61
61 -
 62
62 -
63
-
64
-
65
-
66
-
67
-
68
-
69
-
70
-
71
-
72
-
73
-
74
-
75
-
76
-
77
-
78
-
79
-
80
-
81
-
82
-
83
-
84
-
85
-
86
-
87
-
88
-
89
-
90
-
91
-
92
-
93
-
94
-
95
-
96
-
97
-
98
-
99
-
100
-
101
-
102
-
103
-
104
-
105
-
106
-
107
-
108
-
109
-
110
-
111
-
112
-
113
-
114
-
115
-
116
-
117
-
118
-
119
-
120
-
121
-
122
-
123
-
124
-
125
-
126
-
127
-
128
-
129
-
130
-
131
-
132
-
133
-
134
-
135
-
136
-
137
-
138
-
139
-
140
-
141
-
142
-
143
-
144
-
145
-
146
-
147
-
148
-
149
-
150
-
151
-
152
-
153
-
154
-
155
-
156
-
157
-
158
-
159
-
160
-
161
-
162
-
163
-
164
-
165
-
166
-
167
-
168
-
169
-
170
-
171
-
172
-
173
-
174
-
175
-
176
-
177
-
178
-
179
-
180
-
181
-
182
-
183
-
184
-
185
-
186
-
187
-
188
-
189
-
190
-
191
-
192
-
193
-
194
-
195
-
196
-
197
-
198
-
199
-
200
-
201
-
202
-
203
-
204
-
205
-
206
-
207
-
208
-
209
-
210
-
211
-
212
-
213
-
214
-
215
-
216
-
217
-
218
-
219
-
220
-
221
-
222
-
223
-
224
-
225
-
226
-
227
 |
 |

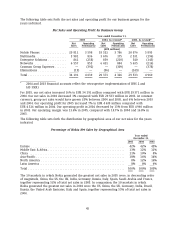
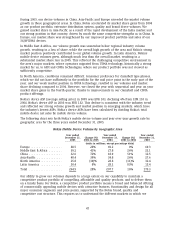
Global Mobile Infrastructure Market Size by Geographic Area
based on Nokia’s Estimates
Year ended Year ended Year ended
December 31, Change (%) December 31, Change (%) December 31,
2005 2004 to 2005 2004 2003 to 2004 2003
(EUR billions, except percentage data)
Europe ................... 13.9 9% 12.8 15% 11.1
Middle East & Africa ........ 4.5 15% 3.9 23% 3.2
China .................... 5.8 (9)% 6.3 10% 5.7
Asia-Pacific ............... 9.9 20% 8.2 11% 7.4
North America ............. 10.9 11% 9.9 9% 9.1
Latin America ............. 4.3 21% 3.5 32% 2.7
Total .................... 49.3 10% 44.6 14% 39.2
Networks’ sales and profitability are also affected by the product mix. The share of 3G/WCDMA
projects increased from about 17% in 2004 to about 20% in 2005 while the average gross margin
in 3G/WCDMA projects improved close to our average group margin of Networks. Service related
sales, such as roll-out, maintenance, professional and managed services, grew as a proportion of
total sales throughout 2004 and 2005 from approximately 25% in 2004 to over 30% by year end
2005. In 2005, the increased share of services had a slightly negative impact on our profitability as
services generally have lower gross margins than equipment sales and the initial stages of the
contracts tend to also have somewhat lower operating margins.
In 2004, Networks entered several new geographical areas, with the effect that initial roll-out
profitability was negatively impacted by market entry related costs as well as by the highly
competitive nature of these markets. In 2005, we continued this aggressive market strategy with
the intention to build greater scale and customer reach which we expect to result in improving
profitability in the mid to longer term. We also were successful in increasing the number of
swap-outs of competitors’ equipment in 2005. Combined with a more aggressive entry into a
number of fast-growing emerging markets, these factors had a negative impact on Networks
profitability in 2005.
Networks has more than 150 mobile network customers in over 60 countries. Our systems serve
roughly in excess of 400 million customers, a number we expect will grow rapidly given that
many of our customers are in new emerging markets.
50