Nokia 2005 Annual Report Download - page 67
Download and view the complete annual report
Please find page 67 of the 2005 Nokia annual report below. You can navigate through the pages in the report by either clicking on the pages listed below, or by using the keyword search tool below to find specific information within the annual report.-
 1
1 -
2
-
3
-
4
-
5
-
6
-
7
-
8
-
9
-
10
-
11
-
12
-
13
-
14
-
15
-
16
-
17
-
18
-
19
-
20
-
21
-
22
-
23
-
24
-
25
-
26
-
27
-
28
-
29
-
30
-
31
-
32
-
33
-
34
-
35
-
36
-
37
-
38
-
39
-
40
-
41
-
42
-
43
-
44
-
45
-
46
-
47
-
48
-
49
-
50
-
51
-
52
-
53
-
54
-
55
-
56
-
 57
57 -
 58
58 -
 59
59 -
 60
60 -
 61
61 -
 62
62 -
 63
63 -
 64
64 -
 65
65 -
 66
66 -
 67
67 -
 68
68 -
 69
69 -
 70
70 -
 71
71 -
 72
72 -
 73
73 -
 74
74 -
 75
75 -
 76
76 -
 77
77 -
78
-
79
-
80
-
81
-
82
-
83
-
84
-
85
-
86
-
87
-
88
-
89
-
90
-
91
-
92
-
93
-
94
-
95
-
96
-
97
-
98
-
99
-
100
-
101
-
102
-
103
-
104
-
105
-
106
-
107
-
108
-
109
-
110
-
111
-
112
-
113
-
114
-
115
-
116
-
117
-
118
-
119
-
120
-
121
-
122
-
123
-
124
-
125
-
126
-
127
-
128
-
129
-
130
-
131
-
132
-
133
-
134
-
135
-
136
-
137
-
138
-
139
-
140
-
141
-
142
-
143
-
144
-
145
-
146
-
147
-
148
-
149
-
150
-
151
-
152
-
153
-
154
-
155
-
156
-
157
-
158
-
159
-
160
-
161
-
162
-
163
-
164
-
165
-
166
-
167
-
168
-
169
-
170
-
171
-
172
-
173
-
174
-
175
-
176
-
177
-
178
-
179
-
180
-
181
-
182
-
183
-
184
-
185
-
186
-
187
-
188
-
189
-
190
-
191
-
192
-
193
-
194
-
195
-
196
-
197
-
198
-
199
-
200
-
201
-
202
-
203
-
204
-
205
-
206
-
207
-
208
-
209
-
210
-
211
-
212
-
213
-
214
-
215
-
216
-
217
-
218
-
219
-
220
-
221
-
222
-
223
-
224
-
225
-
226
-
227
 |
 |

Net Profit and Earnings per Share
Net profit in 2005 totaled EUR 3 616 million compared with EUR 3 192 million in 2004,
representing a year-on-year increase in net profit of 13% in 2005. Earnings per share in 2005
increased to EUR 0.83 (basic and diluted) compared with EUR 0.69 (basic and diluted) in 2004.
2004 compared with 2003
Nokia Group
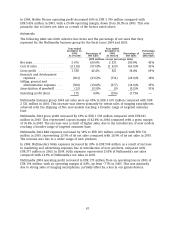
The following table sets forth selective line items and the percentage of net sales that they
represent for Nokia for the fiscal years 2004 and 2003.
Year ended Year ended
December 31, December 31, Percentage
2004 Percentage of 2003 Percentage of Increase/
As revised Net Sales As revised Net Sales (decrease)
(EUR millions, except percentage data)
Net sales .................. 29 371 100.0% 29 533 100.0% (1)%
Cost of sales ................ (18 179) (61.9)% (17 325) (58.7)% 5%
Gross profit ................ 11 192 38.1% 12 208 41.3% (8)%
Research and development
expenses ................. (3 776) (12.9)% (3 788) (12.8)% —
Selling, general and
administrative expenses .... (2 994) (10.2)% (3 376) (11.4)% (11)%
Customer finance impairment
charges, net of reversal ..... — — 226 0.7% (100)%
Impairment of goodwill ...... — — (151) (0.5)% (100)%
Amortization of goodwill ..... (96) (0.3)% (159) (0.5)% (40)%
Operating profit ............. 4 326 14.7% 4 960 16.8% (13)%
For 2004, Nokia net sales decreased 1% to EUR 29.4 billion compared with EUR 29.5 billion in
2003. At constant currency, group net sales would have been up 6%. Our gross margin in 2004
was 38.1% compared with 41.3% in 2003, primarily reflecting lower sales in Mobile Phones.
Research and development, or R&D, expenses were EUR 3.8 billion in both 2004 and 2003.
Research and development expenses represented 12.9% of net sales in 2004, materially unchanged
from 2003. Research and development expenses increased in Mobile Phones, Multimedia and
Enterprise Solutions and decreased in Networks. Networks R&D expenses included impairments of
EUR 115 million in 2004 and personnel-related restructuring costs, impairments and write-offs
totaling EUR 470 million in 2003. If these were excluded, R&D expenses would have increased
10% in 2004, and represented 12.5% of Nokia net sales in 2004 compared with 11.2% of net
sales in 2003.
In 2004, selling, general and administrative, or SG&A, expenses were EUR 3.0 billion, down 11%
from 2003. SG&A expenses were equal to 10.2% of net sales in 2004 compared with 11.4% of net
sales in 2003. SG&A expenses increased in Multimedia and Enterprise Solutions and decreased in
Mobile Phones and Networks. If the return of an insurance premium of EUR 160 million and a
EUR 12 million loss from the divestiture of our holding in Nextrom Holding S.A. were excluded
from the 2004 SG&A expenses, and if the EUR 56 million gain from the sale of the remaining
shares of Nokian Tyres Ltd and the restructuring costs of EUR 80 million related to Networks were
excluded from 2003 SG&A expenses, the decrease in SG&A expenses would have been 6% and SG&A
expenses would have represented 10.7% of Nokia net sales in 2004 compared with 11.4% of net
sales in 2003.
65