Nokia 2005 Annual Report Download - page 207
Download and view the complete annual report
Please find page 207 of the 2005 Nokia annual report below. You can navigate through the pages in the report by either clicking on the pages listed below, or by using the keyword search tool below to find specific information within the annual report.-
 1
1 -
2
-
3
-
4
-
5
-
6
-
7
-
8
-
9
-
10
-
11
-
12
-
13
-
14
-
15
-
16
-
17
-
18
-
19
-
20
-
21
-
22
-
23
-
24
-
25
-
26
-
27
-
28
-
29
-
30
-
31
-
32
-
33
-
34
-
35
-
36
-
37
-
38
-
39
-
40
-
41
-
42
-
43
-
44
-
45
-
46
-
47
-
48
-
49
-
50
-
51
-
52
-
53
-
54
-
55
-
56
-
57
-
58
-
59
-
60
-
61
-
62
-
63
-
64
-
65
-
66
-
67
-
68
-
69
-
70
-
71
-
72
-
73
-
74
-
75
-
76
-
77
-
78
-
79
-
80
-
81
-
82
-
83
-
84
-
85
-
86
-
87
-
88
-
89
-
90
-
91
-
92
-
93
-
94
-
95
-
96
-
97
-
98
-
99
-
100
-
101
-
102
-
103
-
104
-
105
-
106
-
107
-
108
-
109
-
110
-
111
-
112
-
113
-
114
-
115
-
116
-
117
-
118
-
119
-
120
-
121
-
122
-
123
-
124
-
125
-
126
-
127
-
128
-
129
-
130
-
131
-
132
-
133
-
134
-
135
-
136
-
137
-
138
-
139
-
140
-
141
-
142
-
143
-
144
-
145
-
146
-
147
-
148
-
149
-
150
-
151
-
152
-
153
-
154
-
155
-
156
-
157
-
158
-
159
-
160
-
161
-
162
-
163
-
164
-
165
-
166
-
167
-
168
-
169
-
170
-
171
-
172
-
173
-
174
-
175
-
176
-
177
-
178
-
179
-
180
-
181
-
182
-
183
-
184
-
185
-
186
-
187
-
188
-
189
-
190
-
191
-
192
-
193
-
194
-
195
-
196
-
 197
197 -
 198
198 -
 199
199 -
 200
200 -
 201
201 -
 202
202 -
 203
203 -
 204
204 -
 205
205 -
 206
206 -
 207
207 -
 208
208 -
 209
209 -
 210
210 -
 211
211 -
 212
212 -
 213
213 -
 214
214 -
 215
215 -
 216
216 -
 217
217 -
218
-
219
-
220
-
221
-
222
-
223
-
224
-
225
-
226
-
227
 |
 |
Notes to the Consolidated Financial Statements (Continued)
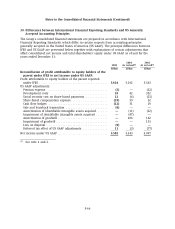
39. Differences between International Financial Reporting Standards and US Generally
Accepted Accounting Principles (Continued)
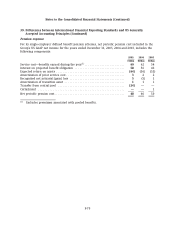
Pension expense and additional minimum liability
Under IFRS, pension assets, defined benefit pension liabilities and pension expense are actuarially
determined in a similar manner to US GAAP. However, under IFRS the prior service cost, transition
adjustments and pension expense resulting from plan amendments are generally recognized
immediately. Under US GAAP, these expenses are generally recognized over a longer period. Also,
under US GAAP the employer should recognize an additional minimum pension liability charged to
other comprehensive income when the accumulated benefit obligation (ABO) exceeds the fair value
of the plan assets and this amount is not covered by the liability recognized in the balance sheet.
The calculation of the ABO is based on approach two as described in EITF 88-1, Determination of
Vested Benefit Obligation for a Defined Benefit Pension Plan, under which the actuarial present
value is based on the date of separation from service.
The US GAAP pension expense adjustments reflect the difference between the prepaid pension
asset and related pension expense as determined by applying IAS 19, Employee Benefits, and the
pension asset and related pension expense determined by applying FAS 87, Employers’ Accounting
for Pensions.
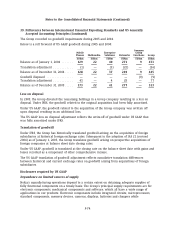
Development costs
Development costs are capitalized under IFRS after the product involved has reached a certain
degree of technical feasibility. Capitalization ceases and depreciation begins when the product
becomes available to customers. The depreciation period of these capitalized assets is between two
and five years.
Under US GAAP, software development costs are similarly capitalized after the product has reached
a certain degree of technological feasibility. However, certain non-software related development
costs capitalized under IFRS are not capitalizable under US GAAP and therefore are expensed.
Under IFRS, whenever there is an indication that capitalized development costs may be impaired
the recoverable amount of the asset is estimated. An asset is impaired when the carrying amount
of the asset exceeds its recoverable amount. Recoverable amount is defined as the higher of an
asset’s net selling price and value in use. Value in use is the present value of estimated discounted
future cash flows expected to arise from the continuing use of an asset and from its disposal at
the end of its useful life.
Under US GAAP, the unamortized capitalized costs of a software product are compared at each
balance sheet date to the net realizable value of that product with any excess written off. Net
realizable value is defined as the estimated future gross revenues from that product reduced by
the estimated future costs of completing and disposing of that product, including the costs of
performing maintenance and customer support required to satisfy the enterprise’s responsibility
set forth at the time of sale.
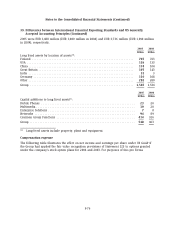
The amount of unamortized capitalized software development costs under US GAAP is
EUR 213 million in 2005 (EUR 210 million in 2004).
The US GAAP development cost adjustment reflects the reversal of capitalized non-software related
development costs under US GAAP net of the reversal of associated amortization expense and
impairments under IFRS. The adjustment also reflects differences in impairment methodologies
F-69