Nokia 2005 Annual Report Download - page 10
Download and view the complete annual report
Please find page 10 of the 2005 Nokia annual report below. You can navigate through the pages in the report by either clicking on the pages listed below, or by using the keyword search tool below to find specific information within the annual report.-
 1
1 -
 2
2 -
 3
3 -
 4
4 -
 5
5 -
 6
6 -
 7
7 -
 8
8 -
 9
9 -
 10
10 -
 11
11 -
 12
12 -
 13
13 -
 14
14 -
 15
15 -
 16
16 -
 17
17 -
 18
18 -
 19
19 -
 20
20 -
 21
21 -
22
-
23
-
24
-
25
-
26
-
27
-
28
-
29
-
30
-
31
-
32
-
33
-
34
-
35
-
36
-
37
-
38
-
39
-
40
-
41
-
42
-
43
-
44
-
45
-
46
-
47
-
48
-
49
-
50
-
51
-
52
-
53
-
54
-
55
-
56
-
57
-
58
-
59
-
60
-
61
-
62
-
63
-
64
-
65
-
66
-
67
-
68
-
69
-
70
-
71
-
72
-
73
-
74
-
75
-
76
-
77
-
78
-
79
-
80
-
81
-
82
-
83
-
84
-
85
-
86
-
87
-
88
-
89
-
90
-
91
-
92
-
93
-
94
-
95
-
96
-
97
-
98
-
99
-
100
-
101
-
102
-
103
-
104
-
105
-
106
-
107
-
108
-
109
-
110
-
111
-
112
-
113
-
114
-
115
-
116
-
117
-
118
-
119
-
120
-
121
-
122
-
123
-
124
-
125
-
126
-
127
-
128
-
129
-
130
-
131
-
132
-
133
-
134
-
135
-
136
-
137
-
138
-
139
-
140
-
141
-
142
-
143
-
144
-
145
-
146
-
147
-
148
-
149
-
150
-
151
-
152
-
153
-
154
-
155
-
156
-
157
-
158
-
159
-
160
-
161
-
162
-
163
-
164
-
165
-
166
-
167
-
168
-
169
-
170
-
171
-
172
-
173
-
174
-
175
-
176
-
177
-
178
-
179
-
180
-
181
-
182
-
183
-
184
-
185
-
186
-
187
-
188
-
189
-
190
-
191
-
192
-
193
-
194
-
195
-
196
-
197
-
198
-
199
-
200
-
201
-
202
-
203
-
204
-
205
-
206
-
207
-
208
-
209
-
210
-
211
-
212
-
213
-
214
-
215
-
216
-
217
-
218
-
219
-
220
-
221
-
222
-
223
-
224
-
225
-
226
-
227
 |
 |

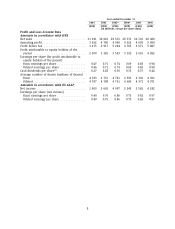
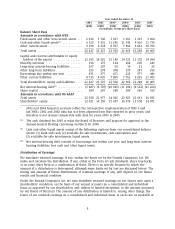
Year ended December 31,
2001 2002 2003* 2004* 2005 2005
(EUR) (EUR) (EUR) (EUR) (EUR) (USD)
(in millions, except per share data)
Profit and Loss Account Data
Amounts in accordance with IFRS
Net sales ............................... 31 191 30 016 29 533 29 371 34 191 40 489
Operating profit .......................... 3 362 4 780 4 960 4 326 4 639 5 494
Profit before tax ......................... 3 475 4 917 5 294 4 705 4 971 5 887
Profit attributable to equity holders of the
parent ............................... 2 200 3 381 3 543 3 192 3 616 4 282
Earnings per share (for profit attributable to
equity holders of the parent)
Basic earnings per share ................. 0.47 0.71 0.74 0.69 0.83 0.98
Diluted earnings per share ............... 0.46 0.71 0.74 0.69 0.83 0.98
Cash dividends per share(1) ................. 0.27 0.28 0.30 0.33 0.37 0.44
Average number of shares (millions of shares)
Basic ................................. 4 703 4 751 4 761 4 593 4 366 4 366
Diluted ............................... 4 787 4 788 4 761 4 600 4 371 4 371
Amounts in accordance with US GAAP
Net income ............................. 1 903 3 603 4 097 3 343 3 582 4 242
Earnings per share (net income)
Basic earnings per share ................. 0.40 0.76 0.86 0.73 0.82 0.97
Diluted earnings per share ............... 0.40 0.75 0.86 0.73 0.82 0.97
8