Nokia 2005 Annual Report Download - page 61
Download and view the complete annual report
Please find page 61 of the 2005 Nokia annual report below. You can navigate through the pages in the report by either clicking on the pages listed below, or by using the keyword search tool below to find specific information within the annual report.-
 1
1 -
2
-
3
-
4
-
5
-
6
-
7
-
8
-
9
-
10
-
11
-
12
-
13
-
14
-
15
-
16
-
17
-
18
-
19
-
20
-
21
-
22
-
23
-
24
-
25
-
26
-
27
-
28
-
29
-
30
-
31
-
32
-
33
-
34
-
35
-
36
-
37
-
38
-
39
-
40
-
41
-
42
-
43
-
44
-
45
-
46
-
47
-
48
-
49
-
50
-
 51
51 -
 52
52 -
 53
53 -
 54
54 -
 55
55 -
 56
56 -
 57
57 -
 58
58 -
 59
59 -
 60
60 -
 61
61 -
 62
62 -
 63
63 -
 64
64 -
 65
65 -
 66
66 -
 67
67 -
 68
68 -
 69
69 -
 70
70 -
 71
71 -
72
-
73
-
74
-
75
-
76
-
77
-
78
-
79
-
80
-
81
-
82
-
83
-
84
-
85
-
86
-
87
-
88
-
89
-
90
-
91
-
92
-
93
-
94
-
95
-
96
-
97
-
98
-
99
-
100
-
101
-
102
-
103
-
104
-
105
-
106
-
107
-
108
-
109
-
110
-
111
-
112
-
113
-
114
-
115
-
116
-
117
-
118
-
119
-
120
-
121
-
122
-
123
-
124
-
125
-
126
-
127
-
128
-
129
-
130
-
131
-
132
-
133
-
134
-
135
-
136
-
137
-
138
-
139
-
140
-
141
-
142
-
143
-
144
-
145
-
146
-
147
-
148
-
149
-
150
-
151
-
152
-
153
-
154
-
155
-
156
-
157
-
158
-
159
-
160
-
161
-
162
-
163
-
164
-
165
-
166
-
167
-
168
-
169
-
170
-
171
-
172
-
173
-
174
-
175
-
176
-
177
-
178
-
179
-
180
-
181
-
182
-
183
-
184
-
185
-
186
-
187
-
188
-
189
-
190
-
191
-
192
-
193
-
194
-
195
-
196
-
197
-
198
-
199
-
200
-
201
-
202
-
203
-
204
-
205
-
206
-
207
-
208
-
209
-
210
-
211
-
212
-
213
-
214
-
215
-
216
-
217
-
218
-
219
-
220
-
221
-
222
-
223
-
224
-
225
-
226
-
227
 |
 |

Non-market vesting conditions attached to the performance shares are included in assumptions
about the number of shares that the employee will ultimately receive relating to projections of
sales and earnings per share. On a regular basis we review the assumptions made and revise the
estimates of the number of performance shares that are expected to be settled, where necessary.
At the date of grant the number of performance shares granted to employees that are expected to
be settled is assumed to be the target amount. Any subsequent revisions to the estimates of the
number of performance shares expected to be settled may increase or decrease total compensation
expense. Such increase or decrease adjusts the prior period compensation expense in the period of
the review on a cumulative basis for unvested performance shares for which compensation
expense has already been recognized in the profit and loss account, and in subsequent periods for
unvested performance shares for which the expense has not yet been recognized in the profit and
loss account. Significant differences in employee option activity, equity market performance and
our projected and actual sales and earnings per share performance, may materially affect future
expense. In addition, the value, if any, an employee ultimately receives from share-based payment
awards may not correspond to the expense amounts recorded by the Group.
Results of Operations
2005 compared with 2004
Nokia Group
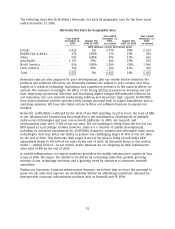
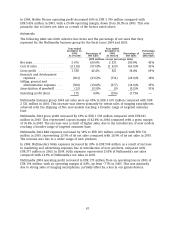
The following table sets forth selective line items and the percentage of net sales that they
represent for Nokia for the fiscal years 2005 and 2004.
Year ended
Year ended December 31, Percentage
December 31, Percentage of 2004 Percentage of Increase/
2005 Net Sales As revised Net Sales (decrease)
(EUR millions, except percentage data)
Net sales .................. 34 191 100.0% 29 371 100.0% 16%
Cost of sales ................ (22 209) (65.0)% (18 179) (61.9)% 22%
Gross profit ................ 11 982 35.0% 11 192 38.1% 7%
Research and development
expenses ................. (3 825) (11.2)% (3 776) (12.9)% 1%
Selling and marketing expenses (2 961) (8.7)% (2 564) (8.7)% 15%
Administrative and general
expenses ................. (609) (1.8)% (611) (2.1)% —
Other operating income and
expenses ................. 52 0.2% 181 0.6% (71)%
Amortization of goodwill ..... — — (96) (0.3)% (100)%
Operating profit ............. 4 639 13.6% 4 326 14.7% 7%
For 2005, Nokia’s net sales increased 16% to EUR 34.2 billion compared with EUR 29.4 billion in
2004. At constant currency, group net sales would have grown 20% in 2005. Our gross margin in
2005 was 35.0% compared with 38.1% in 2004. This reflected the higher proportion of entry level
devices in our product mix in 2005 due to strong volume growth in emerging markets, which
have the industry’s lowest ASPs. Our gross margin in 2005 was also affected by intense price
competition in both the device and infrastructure markets, as well as by the lower margin
services business and emerging markets representing an increased share of Networks sales.
Research and development, or R&D, expenses were EUR 3.8 billion in both 2005 and 2004.
Research and development expenses represented 11.2% of net sales in 2005, down from 12.9% in
59