Nokia 2005 Annual Report Download - page 162
Download and view the complete annual report
Please find page 162 of the 2005 Nokia annual report below. You can navigate through the pages in the report by either clicking on the pages listed below, or by using the keyword search tool below to find specific information within the annual report.-
 1
1 -
2
-
3
-
4
-
5
-
6
-
7
-
8
-
9
-
10
-
11
-
12
-
13
-
14
-
15
-
16
-
17
-
18
-
19
-
20
-
21
-
22
-
23
-
24
-
25
-
26
-
27
-
28
-
29
-
30
-
31
-
32
-
33
-
34
-
35
-
36
-
37
-
38
-
39
-
40
-
41
-
42
-
43
-
44
-
45
-
46
-
47
-
48
-
49
-
50
-
51
-
52
-
53
-
54
-
55
-
56
-
57
-
58
-
59
-
60
-
61
-
62
-
63
-
64
-
65
-
66
-
67
-
68
-
69
-
70
-
71
-
72
-
73
-
74
-
75
-
76
-
77
-
78
-
79
-
80
-
81
-
82
-
83
-
84
-
85
-
86
-
87
-
88
-
89
-
90
-
91
-
92
-
93
-
94
-
95
-
96
-
97
-
98
-
99
-
100
-
101
-
102
-
103
-
104
-
105
-
106
-
107
-
108
-
109
-
110
-
111
-
112
-
113
-
114
-
115
-
116
-
117
-
118
-
119
-
120
-
121
-
122
-
123
-
124
-
125
-
126
-
127
-
128
-
129
-
130
-
131
-
132
-
133
-
134
-
135
-
136
-
137
-
138
-
139
-
140
-
141
-
142
-
143
-
144
-
145
-
146
-
147
-
148
-
149
-
150
-
151
-
 152
152 -
 153
153 -
 154
154 -
 155
155 -
 156
156 -
 157
157 -
 158
158 -
 159
159 -
 160
160 -
 161
161 -
 162
162 -
 163
163 -
 164
164 -
 165
165 -
 166
166 -
 167
167 -
 168
168 -
 169
169 -
 170
170 -
 171
171 -
 172
172 -
173
-
174
-
175
-
176
-
177
-
178
-
179
-
180
-
181
-
182
-
183
-
184
-
185
-
186
-
187
-
188
-
189
-
190
-
191
-
192
-
193
-
194
-
195
-
196
-
197
-
198
-
199
-
200
-
201
-
202
-
203
-
204
-
205
-
206
-
207
-
208
-
209
-
210
-
211
-
212
-
213
-
214
-
215
-
216
-
217
-
218
-
219
-
220
-
221
-
222
-
223
-
224
-
225
-
226
-
227
 |
 |

Notes to the Consolidated Financial Statements (Continued)
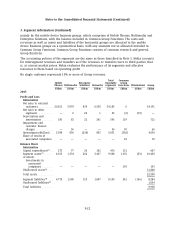
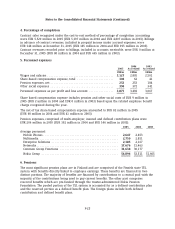
3. Segment information (Continued)
2005 2004 2003
As revised As revised
EURm EURm EURm
Net sales to external customers by geographic area by
location of customer
Finland ............................................... 331 351 347
China ................................................ 3,403 2,678 2,023
USA.................................................. 2,743 3,430 4,488
Great Britain ........................................... 2,405 2,269 2,711
India ................................................. 2,022 1,369 1,064
Germany .............................................. 1,982 1,730 2,297
Other ................................................. 21,305 17,544 16,603
Total ................................................. 34,191 29,371 29,533
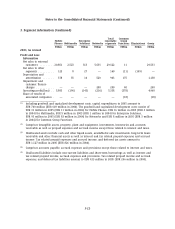
2005 2004
EURm EURm
Segment assets by geographic area
Finland ............................................... 3,619 3,429
China ................................................ 1,120 880
USA.................................................. 1,437 1,025
Great Britain ........................................... 437 502
India ................................................. 416 225
Germany .............................................. 390 353
Other ................................................. 3,031 2,526
Total ................................................. 10,450 8,940
2005 2004 2003
EURm EURm EURm
Capital expenditures by market area
Finland ............................................... 259 216 160
China ................................................ 93 57 53
USA.................................................. 74 80 49
Great Britain ........................................... 12 59
India ................................................. 31 32
Germany .............................................. 26 20 17
Other ................................................. 112 167 142
Total(1) ............................................... 607 548 432
(1) Including goodwill and capitalized development costs, capital expenditures amount to
EUR 760 million in 2005 (EUR 649 million in 2004 and EUR 670 million in 2003). The goodwill
and capitalized development costs in 2005 consist of EUR 0 million in USA (EUR 0 million in
USA in 2004 and EUR 20 million in USA in 2003) and EUR 153 million in other areas
(EUR 101 million in 2004 and EUR 218 million in 2003).
F-24