Nokia 2005 Annual Report Download - page 65
Download and view the complete annual report
Please find page 65 of the 2005 Nokia annual report below. You can navigate through the pages in the report by either clicking on the pages listed below, or by using the keyword search tool below to find specific information within the annual report.-
 1
1 -
2
-
3
-
4
-
5
-
6
-
7
-
8
-
9
-
10
-
11
-
12
-
13
-
14
-
15
-
16
-
17
-
18
-
19
-
20
-
21
-
22
-
23
-
24
-
25
-
26
-
27
-
28
-
29
-
30
-
31
-
32
-
33
-
34
-
35
-
36
-
37
-
38
-
39
-
40
-
41
-
42
-
43
-
44
-
45
-
46
-
47
-
48
-
49
-
50
-
51
-
52
-
53
-
54
-
 55
55 -
 56
56 -
 57
57 -
 58
58 -
 59
59 -
 60
60 -
 61
61 -
 62
62 -
 63
63 -
 64
64 -
 65
65 -
 66
66 -
 67
67 -
 68
68 -
 69
69 -
 70
70 -
 71
71 -
 72
72 -
 73
73 -
 74
74 -
 75
75 -
76
-
77
-
78
-
79
-
80
-
81
-
82
-
83
-
84
-
85
-
86
-
87
-
88
-
89
-
90
-
91
-
92
-
93
-
94
-
95
-
96
-
97
-
98
-
99
-
100
-
101
-
102
-
103
-
104
-
105
-
106
-
107
-
108
-
109
-
110
-
111
-
112
-
113
-
114
-
115
-
116
-
117
-
118
-
119
-
120
-
121
-
122
-
123
-
124
-
125
-
126
-
127
-
128
-
129
-
130
-
131
-
132
-
133
-
134
-
135
-
136
-
137
-
138
-
139
-
140
-
141
-
142
-
143
-
144
-
145
-
146
-
147
-
148
-
149
-
150
-
151
-
152
-
153
-
154
-
155
-
156
-
157
-
158
-
159
-
160
-
161
-
162
-
163
-
164
-
165
-
166
-
167
-
168
-
169
-
170
-
171
-
172
-
173
-
174
-
175
-
176
-
177
-
178
-
179
-
180
-
181
-
182
-
183
-
184
-
185
-
186
-
187
-
188
-
189
-
190
-
191
-
192
-
193
-
194
-
195
-
196
-
197
-
198
-
199
-
200
-
201
-
202
-
203
-
204
-
205
-
206
-
207
-
208
-
209
-
210
-
211
-
212
-
213
-
214
-
215
-
216
-
217
-
218
-
219
-
220
-
221
-
222
-
223
-
224
-
225
-
226
-
227
 |
 |

In Enterprise Solutions, gross profit increased by 10% to EUR 402 million due to higher sales,
compared with EUR 364 million in 2004. This represented a gross margin of 46.7% in 2005
compared with a gross margin of 43.4% in 2004.
In Enterprise Solutions, R&D expenses in 2005 increased by 8% to EUR 329 million due to the
target to broaden the product offering including the launch of Nokia Business Center and Eseries
products. R&D expenses in 2004 were EUR 304 million. R&D expenses represented 38.2% of
Enterprise Solutions net sales in 2005 and 36.2% of its net sales in 2004.
In 2005, Enterprise Solutions selling and marketing expenses increased by 11% to EUR 221 million
as a result of the marketing of the Nokia 9300 enterprise smartphone and the launch of Eseries
products. Selling and marketing expenses were EUR 199 million in 2004. In 2005, selling and
marketing expenses represented 25.7% of Enterprise Solutions net sales and 23.7% of its net sales
in 2004.
Other operating income and expenses in 2005 included a EUR 29 million restructuring charge for
personnel expenses primarily related to headcount reductions.
Enterprise Solutions operating loss increased 23% to EUR 258 million (including a EUR 29 million
restructuring charge) in 2005 compared with a loss of EUR 210 million in 2004, with an operating
margin of -30.0% in 2005 and an operating margin of -25.0% in 2004.
Networks
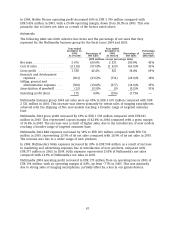
The following table sets forth selective line items and the percentage of net sales that they
represent for the Networks business group for the fiscal years 2005 and 2004.
Year ended
Year ended December 31, Percentage
December 31, Percentage of 2004 Percentage of Increase/
2005 Net Sales As revised Net Sales (decrease)
(EUR millions, except percentage data)
Net sales .................. 6 557 100.0% 6 431 100.0% 2%
Cost of Sales ................ (3 967) (60.5)% (3 688) (57.3)% 8%
Gross profit ................ 2 590 39.5% 2 743 42.7% (6)%
Research and development
expenses ................. (1 170) (17.8)% (1 194) (18.6)% (2)%
Selling and marketing expenses (475) (7.3)% (503) (7.8)% 6%
Administrative and general
expenses ................. (211) (3.2)% (210) (3.3)% —
Other income and expenses . . . 121 1.8% 48 0.7% 152%
Amortization of goodwill ..... — — — — —
Operating profit ............. 855 13.0% 884 13.7% (3)%
Networks business group 2005 net sales increased 2% to EUR 6 557 million compared with
EUR 6 431 million in 2004. At constant currency, Networks business group net sales would have
been up 6%. Strong sales growth in Latin America and Asia-Pacific was offset by sales declines in
China and North America, while sales in Europe remained virtually unchanged.
In Networks, gross profit decreased by 6% to EUR 2 590 million primarily due to investments in
the growing network services market, which generally has lower gross margins than equipment
sales, as well as intense price pressure and our ongoing push into markets where historically we
have not had a presence, compared with EUR 2 743 million in 2004. This represented a gross
margin of 39.5% in 2005 compared with a gross margin of 42.7% in 2004.
63