Nokia 2005 Annual Report Download - page 159
Download and view the complete annual report
Please find page 159 of the 2005 Nokia annual report below. You can navigate through the pages in the report by either clicking on the pages listed below, or by using the keyword search tool below to find specific information within the annual report.-
 1
1 -
 2
2 -
 3
3 -
 4
4 -
 5
5 -
 6
6 -
 7
7 -
 8
8 -
 9
9 -
 10
10 -
 11
11 -
 12
12 -
 13
13 -
 14
14 -
 15
15 -
 16
16 -
 17
17 -
 18
18 -
 19
19 -
 20
20 -
 21
21 -
 22
22 -
 23
23 -
 24
24 -
 25
25 -
 26
26 -
 27
27 -
 28
28 -
 29
29 -
 30
30 -
 31
31 -
 32
32 -
 33
33 -
 34
34 -
 35
35 -
 36
36 -
 37
37 -
 38
38 -
 39
39 -
 40
40 -
 41
41 -
 42
42 -
 43
43 -
 44
44 -
 45
45 -
 46
46 -
 47
47 -
 48
48 -
 49
49 -
 50
50 -
 51
51 -
 52
52 -
 53
53 -
 54
54 -
 55
55 -
 56
56 -
 57
57 -
 58
58 -
 59
59 -
 60
60 -
 61
61 -
 62
62 -
 63
63 -
 64
64 -
 65
65 -
 66
66 -
 67
67 -
 68
68 -
 69
69 -
 70
70 -
 71
71 -
 72
72 -
 73
73 -
 74
74 -
 75
75 -
 76
76 -
 77
77 -
 78
78 -
 79
79 -
 80
80 -
 81
81 -
 82
82 -
 83
83 -
 84
84 -
 85
85 -
 86
86 -
 87
87 -
 88
88 -
 89
89 -
 90
90 -
 91
91 -
 92
92 -
 93
93 -
 94
94 -
 95
95 -
 96
96 -
 97
97 -
 98
98 -
 99
99 -
 100
100 -
 101
101 -
 102
102 -
 103
103 -
 104
104 -
 105
105 -
 106
106 -
 107
107 -
 108
108 -
 109
109 -
 110
110 -
 111
111 -
 112
112 -
 113
113 -
 114
114 -
 115
115 -
 116
116 -
 117
117 -
 118
118 -
 119
119 -
 120
120 -
 121
121 -
 122
122 -
 123
123 -
 124
124 -
 125
125 -
 126
126 -
 127
127 -
 128
128 -
 129
129 -
 130
130 -
 131
131 -
 132
132 -
 133
133 -
 134
134 -
 135
135 -
 136
136 -
 137
137 -
 138
138 -
 139
139 -
 140
140 -
 141
141 -
 142
142 -
 143
143 -
 144
144 -
 145
145 -
 146
146 -
 147
147 -
 148
148 -
 149
149 -
 150
150 -
 151
151 -
 152
152 -
 153
153 -
 154
154 -
 155
155 -
 156
156 -
 157
157 -
 158
158 -
 159
159 -
 160
160 -
 161
161 -
 162
162 -
 163
163 -
 164
164 -
 165
165 -
 166
166 -
 167
167 -
 168
168 -
 169
169 -
 170
170 -
 171
171 -
 172
172 -
 173
173 -
 174
174 -
 175
175 -
 176
176 -
 177
177 -
 178
178 -
 179
179 -
 180
180 -
 181
181 -
 182
182 -
 183
183 -
 184
184 -
 185
185 -
 186
186 -
 187
187 -
 188
188 -
 189
189 -
 190
190 -
 191
191 -
 192
192 -
 193
193 -
 194
194 -
 195
195 -
 196
196 -
 197
197 -
 198
198 -
 199
199 -
 200
200 -
 201
201 -
 202
202 -
 203
203 -
 204
204 -
 205
205 -
 206
206 -
 207
207 -
 208
208 -
 209
209 -
 210
210 -
 211
211 -
 212
212 -
 213
213 -
 214
214 -
 215
215 -
 216
216 -
 217
217 -
 218
218 -
 219
219 -
 220
220 -
 221
221 -
 222
222 -
 223
223 -
 224
224 -
 225
225 -
 226
226 -
 227
227
 |
 |

Notes to the Consolidated Financial Statements (Continued)
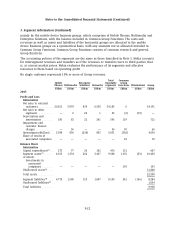
3. Segment information (Continued)
mainly by the mobile device business groups, which comprises of Mobile Phones, Multimedia and
Enterprise Solutions, with the balance included in Common Group Functions. The costs and
revenues as well as assets and liabilities of the horizontal groups are allocated to the mobile
device business groups on a symmetrical basis; with any amounts not so allocated included in
Common Group Functions. Common Group Functions consists of common research and general
Group functions.
The accounting policies of the segments are the same as those described in Note 1. Nokia accounts
for intersegment revenues and transfers as if the revenues or transfers were to third parties, that
is, at current market prices. Nokia evaluates the performance of its segments and allocates
resources to them based on operating profit.
No single customer represents 10% or more of Group revenues.
Total Common
Mobile Enterprise reportable Group
Phones Multimedia Solutions Networks segments Functions Eliminations Group
EURm EURm EURm EURm EURm EURm EURm EURm
2005
Profit and Loss
Information
Net sales to external
customers ......... 20,811 5,979 839 6,556 34,185 6 34,191
Net sales to other
segments .......... — 2 22 1 25 (6) (19) —
Depreciation and
amortization ....... 247 83 22 241 593 119 712
Impairment and
customer finance
charges ........... — 36 — — 36 30 66
Operating profit/(loss) . . 3,598 836 (258) 855 5,031 (392) 4,639
Share of results of
associated companies — — — — — 10 10
Balance Sheet
Information
Capital expenditures(1) . . 273 77 24 102 476 131 607
Segment assets(2) ...... 4,355 1,374 202 3,437 9,368 1,135 (53) 10,450
of which:
Investments in
associated
companies ....... — — — — — 193 193
Unallocated assets(3) ... 11,848
Total assets .......... 22,298
Segment liabilities(4) . . . 4,772 1,505 315 1,607 8,199 241 (156) 8,284
Unallocated liabilities(5) . 1,654
Total liabilities ....... 9,938
F-21
