Nokia 2005 Annual Report Download - page 184
Download and view the complete annual report
Please find page 184 of the 2005 Nokia annual report below. You can navigate through the pages in the report by either clicking on the pages listed below, or by using the keyword search tool below to find specific information within the annual report.-
 1
1 -
2
-
3
-
4
-
5
-
6
-
7
-
8
-
9
-
10
-
11
-
12
-
13
-
14
-
15
-
16
-
17
-
18
-
19
-
20
-
21
-
22
-
23
-
24
-
25
-
26
-
27
-
28
-
29
-
30
-
31
-
32
-
33
-
34
-
35
-
36
-
37
-
38
-
39
-
40
-
41
-
42
-
43
-
44
-
45
-
46
-
47
-
48
-
49
-
50
-
51
-
52
-
53
-
54
-
55
-
56
-
57
-
58
-
59
-
60
-
61
-
62
-
63
-
64
-
65
-
66
-
67
-
68
-
69
-
70
-
71
-
72
-
73
-
74
-
75
-
76
-
77
-
78
-
79
-
80
-
81
-
82
-
83
-
84
-
85
-
86
-
87
-
88
-
89
-
90
-
91
-
92
-
93
-
94
-
95
-
96
-
97
-
98
-
99
-
100
-
101
-
102
-
103
-
104
-
105
-
106
-
107
-
108
-
109
-
110
-
111
-
112
-
113
-
114
-
115
-
116
-
117
-
118
-
119
-
120
-
121
-
122
-
123
-
124
-
125
-
126
-
127
-
128
-
129
-
130
-
131
-
132
-
133
-
134
-
135
-
136
-
137
-
138
-
139
-
140
-
141
-
142
-
143
-
144
-
145
-
146
-
147
-
148
-
149
-
150
-
151
-
152
-
153
-
154
-
155
-
156
-
157
-
158
-
159
-
160
-
161
-
162
-
163
-
164
-
165
-
166
-
167
-
168
-
169
-
170
-
171
-
172
-
173
-
 174
174 -
 175
175 -
 176
176 -
 177
177 -
 178
178 -
 179
179 -
 180
180 -
 181
181 -
 182
182 -
 183
183 -
 184
184 -
 185
185 -
 186
186 -
 187
187 -
 188
188 -
 189
189 -
 190
190 -
 191
191 -
 192
192 -
 193
193 -
 194
194 -
195
-
196
-
197
-
198
-
199
-
200
-
201
-
202
-
203
-
204
-
205
-
206
-
207
-
208
-
209
-
210
-
211
-
212
-
213
-
214
-
215
-
216
-
217
-
218
-
219
-
220
-
221
-
222
-
223
-
224
-
225
-
226
-
227
 |
 |

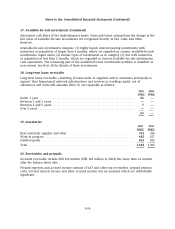
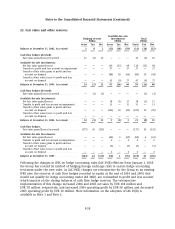
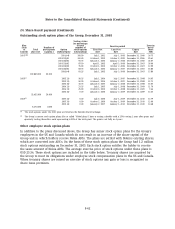
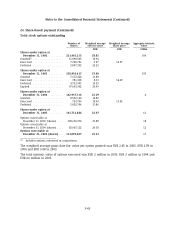
Notes to the Consolidated Financial Statements (Continued)
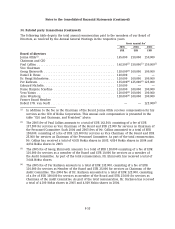
24. Share-based payment (Continued)
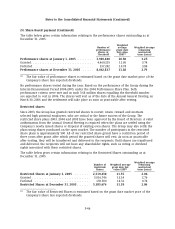
The table below gives certain information relating to the performance shares outstanding as at
December 31, 2005.
Weighted
Number of average Weighted average
performance grant date remaining
shares at fair value contractual
Threshold EUR(1) term (years)
Performance shares at January 1, 2005 .......... 3,910,840 10.58 3.25
Granted ..................................... 4,469,219 11.86 3.74
Forfeited .................................... 337,242 10.74 3.88
Performance shares at December 31, 2005 ....... 8,042,817 11.28 2.79
(1) The fair value of performance shares is estimated based on the grant date market price of the
Company’s share less expected dividends.
No performance shares vested during the year. Based on the performance of the Group during the
Interim Measurement Period 2004-2005, under the 2004 Performance Share Plan, both
performance criteria were met and as such 3.68 million shares equalling the threshold number
are expected to vest in 2006. The shares will vest as of the date of the Annual General Meeting on
March 30, 2006 and the settlement will take place as soon as practicable after vesting.
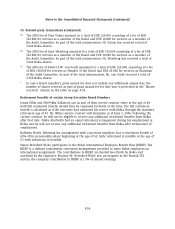
Restricted shares
Since 2003, the Group has granted restricted shares to recruit, retain, reward and motivate
selected high potential employees, who are critical to the future success of the Group. The
restricted share plans 2003, 2004 and 2005 have been approved by the Board of Directors. A valid
authorization from the Annual General Meeting is required when the plans are settled using the
Company’s newly issued shares or disposal of existing own shares. The Group may also settle the
plans using shares purchased on the open market. The number of participants in the restricted
share plans is approximately 500. All of our restricted share grants have a restriction period of
three years after grant, after which period the granted shares will vest. As soon as practicable
after vesting, they will be transferred and delivered to the recipients. Until shares are transferred
and delivered, the recipients will not have any shareholder rights, such as voting or dividend
rights associated with these restricted shares.
The table below gives certain information relating to the Restricted Shares outstanding as at
December 31, 2005.
Weighted average
Number of Weighted average remaining
Restricted grant date fair contractual
Shares value EUR(1) term (years)
Restricted Shares at January 1, 2005 .......... 2,319,430 11.55 2.06
Granted ................................... 3,016,746 12.14 2.76
Forfeited .................................. 150,500 14.31 0.74
Restricted Shares at December 31, 2005 ........ 5,185,676 11.59 2.06
(1) The fair value of Restricted Shares is estimated based on the grant date market price of the
Company’s share less expected dividends.
F-46