Nokia 2005 Annual Report Download - page 77
Download and view the complete annual report
Please find page 77 of the 2005 Nokia annual report below. You can navigate through the pages in the report by either clicking on the pages listed below, or by using the keyword search tool below to find specific information within the annual report.-
 1
1 -
2
-
3
-
4
-
5
-
6
-
7
-
8
-
9
-
10
-
11
-
12
-
13
-
14
-
15
-
16
-
17
-
18
-
19
-
20
-
21
-
22
-
23
-
24
-
25
-
26
-
27
-
28
-
29
-
30
-
31
-
32
-
33
-
34
-
35
-
36
-
37
-
38
-
39
-
40
-
41
-
42
-
43
-
44
-
45
-
46
-
47
-
48
-
49
-
50
-
51
-
52
-
53
-
54
-
55
-
56
-
57
-
58
-
59
-
60
-
61
-
62
-
63
-
64
-
65
-
66
-
 67
67 -
 68
68 -
 69
69 -
 70
70 -
 71
71 -
 72
72 -
 73
73 -
 74
74 -
 75
75 -
 76
76 -
 77
77 -
 78
78 -
 79
79 -
 80
80 -
 81
81 -
 82
82 -
 83
83 -
 84
84 -
 85
85 -
 86
86 -
 87
87 -
88
-
89
-
90
-
91
-
92
-
93
-
94
-
95
-
96
-
97
-
98
-
99
-
100
-
101
-
102
-
103
-
104
-
105
-
106
-
107
-
108
-
109
-
110
-
111
-
112
-
113
-
114
-
115
-
116
-
117
-
118
-
119
-
120
-
121
-
122
-
123
-
124
-
125
-
126
-
127
-
128
-
129
-
130
-
131
-
132
-
133
-
134
-
135
-
136
-
137
-
138
-
139
-
140
-
141
-
142
-
143
-
144
-
145
-
146
-
147
-
148
-
149
-
150
-
151
-
152
-
153
-
154
-
155
-
156
-
157
-
158
-
159
-
160
-
161
-
162
-
163
-
164
-
165
-
166
-
167
-
168
-
169
-
170
-
171
-
172
-
173
-
174
-
175
-
176
-
177
-
178
-
179
-
180
-
181
-
182
-
183
-
184
-
185
-
186
-
187
-
188
-
189
-
190
-
191
-
192
-
193
-
194
-
195
-
196
-
197
-
198
-
199
-
200
-
201
-
202
-
203
-
204
-
205
-
206
-
207
-
208
-
209
-
210
-
211
-
212
-
213
-
214
-
215
-
216
-
217
-
218
-
219
-
220
-
221
-
222
-
223
-
224
-
225
-
226
-
227
 |
 |

As a strategic market requirement, we plan to continue to provide customer financing and
extended payment terms to a small number of selected customers. We continue to make
arrangements with financial institutions and investors to sell credit risk we have incurred from
the commitments and outstanding loans we have made as well as from the financial guarantees
we have given. Should the demand for customer finance increase in the future, we intend to
further mitigate our total structured financing exposure, market conditions permitting.
We expect our structured financing commitments to be financed mainly through cash flow from
operations as well as through the capital markets.
All structured financing commitments are available under loan facilities negotiated with the
borrowers Availability of the amounts is dependent upon the borrower’s continuing compliance
with stated financial and operational covenants and compliance with other administrative terms
of the facility. Certain loans may be partially secured through either guarantees by the borrower’s
direct or indirect parent or other group companies, or shares and/or other assets of the borrower,
its parent or other entities under common ownership.
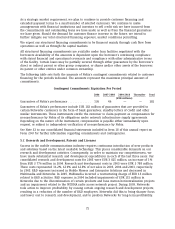
The following table sets forth the amounts of Nokia’s contingent commitments related to customer
financing for the periods indicated. The amounts represent the maximum principal amount of
commitments.
Contingent Commitments Expiration Per Period
2006 2007-2008 2009-2010 Thereafter Total
(EUR millions)
Guarantees of Nokia’s performance .............. 136 46 — — 182
Guarantees of Nokia’s performance include EUR 182 million of guarantees that are provided to
certain Networks customers in the form of bank guarantees, standby letters of credit and other
similar instruments. These instruments entitle the customer to claim payment as compensation for
non-performance by Nokia of its obligations under network infrastructure supply agreements.
Depending on the nature of the instrument, compensation is payable either immediately upon
request, or subject to independent verification of non-performance by Nokia.
See Note 32 to our consolidated financial statements included in Item 18 of this annual report on
Form 20-F for further information regarding commitments and contingencies.
5.C Research and Development, Patents and Licenses
Success in the mobile communications industry requires continuous introduction of new products
and solutions based on the latest available technology. This places considerable demands on our
research and development activities. Consequently, in order to maintain our competitiveness, we
have made substantial research and development expenditures in each of the last three years. Our
consolidated research and development costs for 2005 were EUR 3 825 million, an increase of 1%
from EUR 3 776 million in 2004. Research and development costs in 2003 were EUR 3 788 million.
These costs represented 11.2%, 12.9% and 12.8% of net sales in 2005, 2004 and 2003, respectively.
In 2005, R&D expenses increased in Mobile Phones and Enterprise Solutions and decreased in
Multimedia and Networks. In 2005, Multimedia incurred a restructuring charge of EUR 15 million
related to R&D activities. R&D expenses in 2004 included impairments of EUR 115 million in
Networks due to the discontinuation of certain products and base station horizontalization projects
and an impairment related to the WCDMA radio access network project. During 2003, Networks
took action to improve profitability by ceasing certain ongoing research and development projects,
resulting in a reduction of the number of R&D employees. Networks did this to bring sharper focus
and lower cost to research and development, and to position Networks for long-term profitability.
75