Nokia 2005 Annual Report Download - page 11
Download and view the complete annual report
Please find page 11 of the 2005 Nokia annual report below. You can navigate through the pages in the report by either clicking on the pages listed below, or by using the keyword search tool below to find specific information within the annual report.-
 1
1 -
 2
2 -
 3
3 -
 4
4 -
 5
5 -
 6
6 -
 7
7 -
 8
8 -
 9
9 -
 10
10 -
 11
11 -
 12
12 -
 13
13 -
 14
14 -
 15
15 -
 16
16 -
 17
17 -
 18
18 -
 19
19 -
 20
20 -
 21
21 -
 22
22 -
23
-
24
-
25
-
26
-
27
-
28
-
29
-
30
-
31
-
32
-
33
-
34
-
35
-
36
-
37
-
38
-
39
-
40
-
41
-
42
-
43
-
44
-
45
-
46
-
47
-
48
-
49
-
50
-
51
-
52
-
53
-
54
-
55
-
56
-
57
-
58
-
59
-
60
-
61
-
62
-
63
-
64
-
65
-
66
-
67
-
68
-
69
-
70
-
71
-
72
-
73
-
74
-
75
-
76
-
77
-
78
-
79
-
80
-
81
-
82
-
83
-
84
-
85
-
86
-
87
-
88
-
89
-
90
-
91
-
92
-
93
-
94
-
95
-
96
-
97
-
98
-
99
-
100
-
101
-
102
-
103
-
104
-
105
-
106
-
107
-
108
-
109
-
110
-
111
-
112
-
113
-
114
-
115
-
116
-
117
-
118
-
119
-
120
-
121
-
122
-
123
-
124
-
125
-
126
-
127
-
128
-
129
-
130
-
131
-
132
-
133
-
134
-
135
-
136
-
137
-
138
-
139
-
140
-
141
-
142
-
143
-
144
-
145
-
146
-
147
-
148
-
149
-
150
-
151
-
152
-
153
-
154
-
155
-
156
-
157
-
158
-
159
-
160
-
161
-
162
-
163
-
164
-
165
-
166
-
167
-
168
-
169
-
170
-
171
-
172
-
173
-
174
-
175
-
176
-
177
-
178
-
179
-
180
-
181
-
182
-
183
-
184
-
185
-
186
-
187
-
188
-
189
-
190
-
191
-
192
-
193
-
194
-
195
-
196
-
197
-
198
-
199
-
200
-
201
-
202
-
203
-
204
-
205
-
206
-
207
-
208
-
209
-
210
-
211
-
212
-
213
-
214
-
215
-
216
-
217
-
218
-
219
-
220
-
221
-
222
-
223
-
224
-
225
-
226
-
227
 |
 |

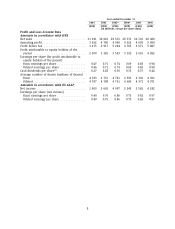
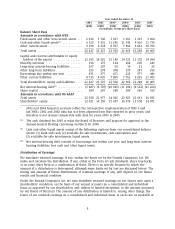
Year ended December 31,
2001 2002 2003* 2004* 2005 2005
(EUR) (EUR) (EUR) (EUR) (EUR) (USD)
(in millions, except per share data)
Balance Sheet Data
Amounts in accordance with IFRS
Fixed assets and other non-current assets . . . 6 912 5 742 3 837 3 161 3 347 3 964
Cash and other liquid assets(2) ............. 6 125 9 351 11 296 11 542 9 910 11 735
Other current assets ..................... 9 390 8 234 8 787 7 966 9 041 10 706
Total assets ........................... 22 427 23 327 23 920 22 669 22 298 26 405
Capital and reserves attributable to equity
holders of the parent .................. 12 205 14 281 15 148 14 231 12 155 14 394
Minority interests ...................... 196 173 164 168 205 243
Long-term interest-bearing liabilities ....... 207 187 20 19 21 25
Other long-term liabilities ................ 253 274 308 275 247 292
Borrowings due within one year .......... 831 377 471 215 377 446
Other current liabilities .................. 8 735 8 035 7 809 7 761 9 293 11 005
Total shareholders’ equity and liabilities .... 22 427 23 327 23 920 22 669 22 298 26 405
Net interest-bearing debt(3) ............... (5 087) (8 787) (10 805) (11 308) (9 512) (11 264)
Share capital .......................... 284 287 288 280 266 315
Amounts in accordance with US GAAP
Total assets ........................... 22 038 22 977 24 045 22 921 22 661 26 835
Shareholders’ equity .................... 12 021 14 150 15 437 14 576 12 558 14 871
*2003 and 2004 financial accounts reflect the retrospective implementation of IFRS 2 and
IAS 39(R). 2001 and 2002 data has not been adjusted from that reported in prior years, and
therefore is not always comparable with data for years 2003 to 2005.
(1) The cash dividend for 2005 is what the Board of Directors will propose for approval at the
Annual General Meeting convening on March 30, 2006.
(2) Cash and other liquid assets consist of the following captions from our consolidated balance
sheets: (1) bank and cash, (2) available-for-sale investments, cash equivalents and
(3) available-for-sale investments, liquid assets.
(3) Net interest-bearing debt consists of borrowings due within one year and long-term interest-
bearing liabilities, less cash and other liquid assets.
Distribution of Earnings
We distribute retained earnings, if any, within the limits set by the Finnish Companies Act. We
make and calculate the distribution, if any, either in the form of cash dividends, share buy-backs,
or in some other form or a combination of these. There is no specific formula by which the
amount of a distribution is determined, although some limits set by law are discussed below. The
timing and amount of future distributions of retained earnings, if any, will depend on our future
results and financial condition.
Under the Finnish Companies Act, we may distribute retained earnings on our shares only upon a
shareholders’ resolution, on the basis of our annual accounts on a consolidated and individual
basis, as approved by our shareholders and, subject to limited exceptions, in the amount proposed
by our Board of Directors. The amount of any distribution is limited to, among other things, the
lower of our retained earnings on a consolidated and individual basis, in each case as available at
9