Nokia 2005 Annual Report Download - page 50
Download and view the complete annual report
Please find page 50 of the 2005 Nokia annual report below. You can navigate through the pages in the report by either clicking on the pages listed below, or by using the keyword search tool below to find specific information within the annual report.-
 1
1 -
2
-
3
-
4
-
5
-
6
-
7
-
8
-
9
-
10
-
11
-
12
-
13
-
14
-
15
-
16
-
17
-
18
-
19
-
20
-
21
-
22
-
23
-
24
-
25
-
26
-
27
-
28
-
29
-
30
-
31
-
32
-
33
-
34
-
35
-
36
-
37
-
38
-
39
-
 40
40 -
 41
41 -
 42
42 -
 43
43 -
 44
44 -
 45
45 -
 46
46 -
 47
47 -
 48
48 -
 49
49 -
 50
50 -
 51
51 -
 52
52 -
 53
53 -
 54
54 -
 55
55 -
 56
56 -
 57
57 -
 58
58 -
 59
59 -
 60
60 -
61
-
62
-
63
-
64
-
65
-
66
-
67
-
68
-
69
-
70
-
71
-
72
-
73
-
74
-
75
-
76
-
77
-
78
-
79
-
80
-
81
-
82
-
83
-
84
-
85
-
86
-
87
-
88
-
89
-
90
-
91
-
92
-
93
-
94
-
95
-
96
-
97
-
98
-
99
-
100
-
101
-
102
-
103
-
104
-
105
-
106
-
107
-
108
-
109
-
110
-
111
-
112
-
113
-
114
-
115
-
116
-
117
-
118
-
119
-
120
-
121
-
122
-
123
-
124
-
125
-
126
-
127
-
128
-
129
-
130
-
131
-
132
-
133
-
134
-
135
-
136
-
137
-
138
-
139
-
140
-
141
-
142
-
143
-
144
-
145
-
146
-
147
-
148
-
149
-
150
-
151
-
152
-
153
-
154
-
155
-
156
-
157
-
158
-
159
-
160
-
161
-
162
-
163
-
164
-
165
-
166
-
167
-
168
-
169
-
170
-
171
-
172
-
173
-
174
-
175
-
176
-
177
-
178
-
179
-
180
-
181
-
182
-
183
-
184
-
185
-
186
-
187
-
188
-
189
-
190
-
191
-
192
-
193
-
194
-
195
-
196
-
197
-
198
-
199
-
200
-
201
-
202
-
203
-
204
-
205
-
206
-
207
-
208
-
209
-
210
-
211
-
212
-
213
-
214
-
215
-
216
-
217
-
218
-
219
-
220
-
221
-
222
-
223
-
224
-
225
-
226
-
227
 |
 |
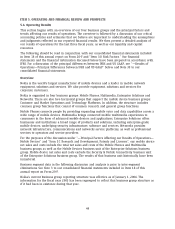
operate, and to identify key market trends and address our customers’ needs in a proactive and
timely manner. Our ability to continuously renew our product portfolio is also key to our success.
We see significant volume growth potential both in the emerging as well as in the developed
markets, both in terms of new subscribers and replacements. Nokia also sees sales growth
opportunities in capturing value from other markets by bringing enhanced mobile experiences to
consumers, such as, mobile photography and mobile music. Nokia also believes there is significant
sales growth potential in bringing mobility to enterprises where the market is still at the early
stages of development.
The enterprise market is emerging as an opportunity for the mobile communications industry.
Businesses are beginning to realize the potential productivity gains, cost savings and competitive
advantages created by secure mobile voice, data and business applications. With our Enterprise
Solutions business group we intend to capture profitable segments of the enterprise market by
offering products and services designed to help enterprises improve their performance by
extending their use of mobility with a diverse range of mobile devices, mobile applications and
security, as well as service and support.
Nokia believes that the device business is increasing in complexity. The industry winners will
need to master an array of challenges to succeed in the marketplace. In our view, winners need to
have great products with the right design, leading technology, a low cost base and excellent
quality, all supported by a world recognized brand. In addition, the winners must possess scale
advantages and excellent manufacturing and logistics. Scale, operational efficiency and cost control
have been and will continue to be important factors affecting Nokia’s profitability and
competitiveness. Our mobile device product costs are comprised of the cost of components,
manufacturing labor and overhead, royalties and license fees, the depreciation of product
machinery, logistics costs as well as warranty and other quality costs. We believe our 2005 device
volume of 265 million units, close to twice the volume of the nearest competitor, gives us sizeable
scale benefits in component procurement. We also believe that effective and efficient research and
development is vital to remaining competitive. For 2005 and 2004, the research and development
expenses represented approximately 9% and 10%, respectively, of mobile device net sales. In 2005,
the sales and marketing costs related to mobile devices were EUR 2.4 billion compared with
EUR 1.9 billion in 2004. We are focusing on return on investment of our marketing expenditure by
further leveraging our scale benefits and by deriving further efficiencies in the investments we
make.
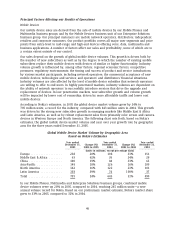
Nokia’s aim is to execute our strategy by expanding the market and also by growing our mobile
device market share. Of all new subscribers estimated to be added over the next three years, a
clear majority are expected to come from the emerging markets. In 2006, we expect to see
continued demand for advanced products, such as camera phones, 3G/WCDMA devices,
smartphones and other mobile multimedia devices and services. In the short term, we believe the
most significant opportunities are in mobile photography, mobile music and continued penetration
of color displays. In 2005, Nokia was a clear leader in Europe, Middle East & Africa, Asia-Pacific,
China, the smartphone market and in the advanced 3G/WCDMA and EDGE technologies. Nokia’s
goal is to increase its overall volume market share in its device business in 2006.
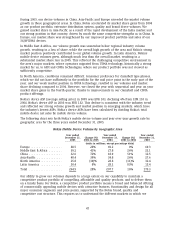
Nokia expects the mobile device market volume to grow more than 10% in 2006, from our
preliminary estimate of approximately 795 million units in 2005. We also expect the device
industry to experience value growth in 2006, but expect some decline in industry ASPs, primarily
reflecting the increasing impact of the emerging markets. Nokia expects the majority of the
industry’s volume growth in 2006 to come from the emerging markets, which are expected to
account for approximately half of the mobile device industry volumes in 2006.
48