Nokia 2005 Annual Report Download - page 180
Download and view the complete annual report
Please find page 180 of the 2005 Nokia annual report below. You can navigate through the pages in the report by either clicking on the pages listed below, or by using the keyword search tool below to find specific information within the annual report.-
 1
1 -
2
-
3
-
4
-
5
-
6
-
7
-
8
-
9
-
10
-
11
-
12
-
13
-
14
-
15
-
16
-
17
-
18
-
19
-
20
-
21
-
22
-
23
-
24
-
25
-
26
-
27
-
28
-
29
-
30
-
31
-
32
-
33
-
34
-
35
-
36
-
37
-
38
-
39
-
40
-
41
-
42
-
43
-
44
-
45
-
46
-
47
-
48
-
49
-
50
-
51
-
52
-
53
-
54
-
55
-
56
-
57
-
58
-
59
-
60
-
61
-
62
-
63
-
64
-
65
-
66
-
67
-
68
-
69
-
70
-
71
-
72
-
73
-
74
-
75
-
76
-
77
-
78
-
79
-
80
-
81
-
82
-
83
-
84
-
85
-
86
-
87
-
88
-
89
-
90
-
91
-
92
-
93
-
94
-
95
-
96
-
97
-
98
-
99
-
100
-
101
-
102
-
103
-
104
-
105
-
106
-
107
-
108
-
109
-
110
-
111
-
112
-
113
-
114
-
115
-
116
-
117
-
118
-
119
-
120
-
121
-
122
-
123
-
124
-
125
-
126
-
127
-
128
-
129
-
130
-
131
-
132
-
133
-
134
-
135
-
136
-
137
-
138
-
139
-
140
-
141
-
142
-
143
-
144
-
145
-
146
-
147
-
148
-
149
-
150
-
151
-
152
-
153
-
154
-
155
-
156
-
157
-
158
-
159
-
160
-
161
-
162
-
163
-
164
-
165
-
166
-
167
-
168
-
169
-
 170
170 -
 171
171 -
 172
172 -
 173
173 -
 174
174 -
 175
175 -
 176
176 -
 177
177 -
 178
178 -
 179
179 -
 180
180 -
 181
181 -
 182
182 -
 183
183 -
 184
184 -
 185
185 -
 186
186 -
 187
187 -
 188
188 -
 189
189 -
 190
190 -
191
-
192
-
193
-
194
-
195
-
196
-
197
-
198
-
199
-
200
-
201
-
202
-
203
-
204
-
205
-
206
-
207
-
208
-
209
-
210
-
211
-
212
-
213
-
214
-
215
-
216
-
217
-
218
-
219
-
220
-
221
-
222
-
223
-
224
-
225
-
226
-
227
 |
 |

Notes to the Consolidated Financial Statements (Continued)
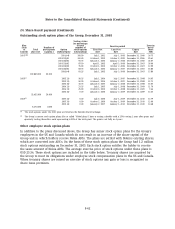
24. Share-based payment (Continued)
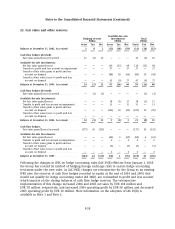
Outstanding stock option plans of the Group, December 31, 2005
Vesting status
(as percentage
Plan of total Exercise
Exercise period
(Year Number of number of price/
of Total participants Option stock options First Vest Last Vest Expiry share
launch) plan size (approx.) (Sub)category outstanding) date date date EUR
2001(1)(2) 2001A+B 100.00 July 1, 2002 July 1, 2005 December 31, 2006 36.75
2001C3Q/01 100.00 October 1, 2002 October 3, 2005 December 31, 2006 20.61
2001C4Q/01 93.75 January 1, 2003 January 2, 2006 December 31, 2006 26.67
2001C1Q/02 87.50 April 1, 2003 April 3, 2006 December 31, 2007 26.06
2001C3Q/02 75.00 October 1, 2003 October 2, 2006 December 31, 2007 12.99
2001C4Q/02 68.75 January 1, 2004 January 2, 2007 December 31, 2007 16.86
2002A+B 81.25 July 1, 2003 July 3, 2006 December 31, 2007 17.89
102,869,000 30,000
2003(2) 2003 2Q 56.25 July 1, 2004 July 2, 2007 December 31, 2008 14.95
2003 3Q 50.00 October 1, 2004 October 1, 2007 December 31, 2008 12.71
2003 4Q 43.75 January 3, 2005 January 2, 2008 December 31, 2008 15.05
2004 2Q 31.25 July 1, 2005 July 1, 2008 December 31, 2009 11.79
2004 3Q 25.00 October 3, 2005 October 1, 2008 December 31, 2009 9.44
2004 4Q 0.00 January 2, 2006 January 2, 2009 December 31, 2009 12.35
33,452,000 20,000
2005(2) 2005 2Q 0.00 July 3, 2006 July 1, 2009 December 31, 2010 12.79
2005 3Q 0.00 October 2, 2006 October 1, 2009 December 31, 2010 13.09
2005 4Q 0.00 January 2, 2007 January 1, 2010 December 31, 2010 14.48
8,174,000 4,000
(1) The stock options under the 2001 plan are listed on the Helsinki Stock Exchange.
(2) The Group’s current stock option plans (the so called ‘‘Global plans’’) have a vesting schedule with a 25% vesting 1 year after grant, and
quarterly vesting thereafter, each representing 6.25% of the total grant. The grants vest fully in 4 years.
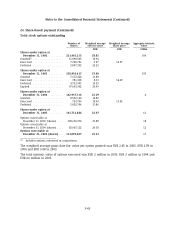
Other employee stock option plans
In addition to the plans discussed above, the Group has minor stock option plans for the Group’s
employees in the US and Canada which do not result in an increase of the share capital of the
Group and in which holders receive Nokia ADSs. The plans are settled with Nokia’s existing shares,
which are converted into ADS’s. On the basis of these stock option plans the Group had 1.2 million
stock options outstanding on December 31, 2005. Each stock option entitles the holder to receive
the same amount of Nokia ADSs. The average exercise price of stock options under these plans is
USD 25.36. These stock options are included in the table below. Treasury shares are acquired by
the Group to meet its obligations under employee stock compensation plans in the US and Canada.
When treasury shares are issued on exercise of stock options any gain or loss is recognized in
share issue premium.
F-42