Nokia 2005 Annual Report Download - page 128
Download and view the complete annual report
Please find page 128 of the 2005 Nokia annual report below. You can navigate through the pages in the report by either clicking on the pages listed below, or by using the keyword search tool below to find specific information within the annual report.-
 1
1 -
2
-
3
-
4
-
5
-
6
-
7
-
8
-
9
-
10
-
11
-
12
-
13
-
14
-
15
-
16
-
17
-
18
-
19
-
20
-
21
-
22
-
23
-
24
-
25
-
26
-
27
-
28
-
29
-
30
-
31
-
32
-
33
-
34
-
35
-
36
-
37
-
38
-
39
-
40
-
41
-
42
-
43
-
44
-
45
-
46
-
47
-
48
-
49
-
50
-
51
-
52
-
53
-
54
-
55
-
56
-
57
-
58
-
59
-
60
-
61
-
62
-
63
-
64
-
65
-
66
-
67
-
68
-
69
-
70
-
71
-
72
-
73
-
74
-
75
-
76
-
77
-
78
-
79
-
80
-
81
-
82
-
83
-
84
-
85
-
86
-
87
-
88
-
89
-
90
-
91
-
92
-
93
-
94
-
95
-
96
-
97
-
98
-
99
-
100
-
101
-
102
-
103
-
104
-
105
-
106
-
107
-
108
-
109
-
110
-
111
-
112
-
113
-
114
-
115
-
116
-
117
-
 118
118 -
 119
119 -
 120
120 -
 121
121 -
 122
122 -
 123
123 -
 124
124 -
 125
125 -
 126
126 -
 127
127 -
 128
128 -
 129
129 -
 130
130 -
 131
131 -
 132
132 -
 133
133 -
 134
134 -
 135
135 -
 136
136 -
 137
137 -
 138
138 -
139
-
140
-
141
-
142
-
143
-
144
-
145
-
146
-
147
-
148
-
149
-
150
-
151
-
152
-
153
-
154
-
155
-
156
-
157
-
158
-
159
-
160
-
161
-
162
-
163
-
164
-
165
-
166
-
167
-
168
-
169
-
170
-
171
-
172
-
173
-
174
-
175
-
176
-
177
-
178
-
179
-
180
-
181
-
182
-
183
-
184
-
185
-
186
-
187
-
188
-
189
-
190
-
191
-
192
-
193
-
194
-
195
-
196
-
197
-
198
-
199
-
200
-
201
-
202
-
203
-
204
-
205
-
206
-
207
-
208
-
209
-
210
-
211
-
212
-
213
-
214
-
215
-
216
-
217
-
218
-
219
-
220
-
221
-
222
-
223
-
224
-
225
-
226
-
227
 |
 |

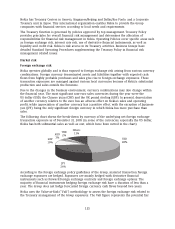
value losses for a portfolio resulting from adverse changes in market factors using a specified time
period and confidence level based on historical data. To correctly take into account the non-linear
price function of certain derivative instruments, Nokia uses Monte Carlo simulation. Volatilities and
correlations are calculated from a one-year set of daily data. The VaR figures assume that the
forecasted cash flows materialize as expected. The VaR figures for the Group transaction foreign
exchange exposure, including hedging transactions and Treasury exposures for netting and risk
management purposes, with a one-week horizon and 95% confidence level, are shown in Table 1,
below.
Table 1 Transaction foreign exchange position Value-at-Risk
VaR 2005 2004
(EUR million)
At December 31 ................................................... 12.4 12.7
Average for the year ............................................... 10.2 14
Range for the year ................................................. 3.3-29.3 1.6-26.9
Since Nokia has subsidiaries outside the Eurozone, the euro-denominated value of the
shareholders’ equity of Nokia is also exposed to fluctuations in exchange rates. Equity changes
caused by movements in foreign exchange rates are shown as a translation difference in the
Group consolidation. Nokia uses, from time to time, foreign exchange contracts and foreign
currency denominated loans to hedge its equity exposure arising from foreign net investments.
Interest rate risk
The Group is exposed to interest rate risk either through market value fluctuations of balance
sheet items (i.e. price risk) and through changes in interest income or expenses (i.e. re-investment
risk). Interest rate risk mainly arises through interest-bearing liabilities and assets. Estimated
future changes in cash flows and balance sheet structure also expose the Group to interest rate
risk.
Treasury is responsible for monitoring and managing the interest rate exposure of the Group. Due
to the current balance sheet structure of Nokia, emphasis is placed on managing the interest rate
risk of investments.
Nokia uses the VaR methodology to assess and measure the interest rate risk in the investment
portfolio, which is benchmarked against a combination of three-month and one-to-three-year
investment horizon. The VaR figure represents the potential fair value losses for a portfolio
resulting from adverse changes in market factors using a specified time period and confidence
level based on historical data. For interest rate risk VaR, Nokia uses variance-covariance
methodology. Volatilities and correlations are calculated from a one-year set of daily data. The
VaR-based interest rate risk figures for an investment portfolio with a one-week horizon and 95%
confidence level are shown in Table 2, below.
Table 2 Treasury investment portfolio Value-at-Risk
VaR 2005 2004
(EUR million)
At December 31 ................................................... 6.9 10.4
Average for the year ............................................... 10.0 6.3
Range for the year ................................................. 6.9-15.3 3.6-10.8
126