Nokia 2005 Annual Report Download - page 51
Download and view the complete annual report
Please find page 51 of the 2005 Nokia annual report below. You can navigate through the pages in the report by either clicking on the pages listed below, or by using the keyword search tool below to find specific information within the annual report.-
 1
1 -
2
-
3
-
4
-
5
-
6
-
7
-
8
-
9
-
10
-
11
-
12
-
13
-
14
-
15
-
16
-
17
-
18
-
19
-
20
-
21
-
22
-
23
-
24
-
25
-
26
-
27
-
28
-
29
-
30
-
31
-
32
-
33
-
34
-
35
-
36
-
37
-
38
-
39
-
40
-
 41
41 -
 42
42 -
 43
43 -
 44
44 -
 45
45 -
 46
46 -
 47
47 -
 48
48 -
 49
49 -
 50
50 -
 51
51 -
 52
52 -
 53
53 -
 54
54 -
 55
55 -
 56
56 -
 57
57 -
 58
58 -
 59
59 -
 60
60 -
 61
61 -
62
-
63
-
64
-
65
-
66
-
67
-
68
-
69
-
70
-
71
-
72
-
73
-
74
-
75
-
76
-
77
-
78
-
79
-
80
-
81
-
82
-
83
-
84
-
85
-
86
-
87
-
88
-
89
-
90
-
91
-
92
-
93
-
94
-
95
-
96
-
97
-
98
-
99
-
100
-
101
-
102
-
103
-
104
-
105
-
106
-
107
-
108
-
109
-
110
-
111
-
112
-
113
-
114
-
115
-
116
-
117
-
118
-
119
-
120
-
121
-
122
-
123
-
124
-
125
-
126
-
127
-
128
-
129
-
130
-
131
-
132
-
133
-
134
-
135
-
136
-
137
-
138
-
139
-
140
-
141
-
142
-
143
-
144
-
145
-
146
-
147
-
148
-
149
-
150
-
151
-
152
-
153
-
154
-
155
-
156
-
157
-
158
-
159
-
160
-
161
-
162
-
163
-
164
-
165
-
166
-
167
-
168
-
169
-
170
-
171
-
172
-
173
-
174
-
175
-
176
-
177
-
178
-
179
-
180
-
181
-
182
-
183
-
184
-
185
-
186
-
187
-
188
-
189
-
190
-
191
-
192
-
193
-
194
-
195
-
196
-
197
-
198
-
199
-
200
-
201
-
202
-
203
-
204
-
205
-
206
-
207
-
208
-
209
-
210
-
211
-
212
-
213
-
214
-
215
-
216
-
217
-
218
-
219
-
220
-
221
-
222
-
223
-
224
-
225
-
226
-
227
 |
 |
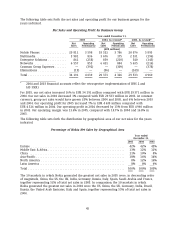
Nokia estimates that the replacement market will represent over 60% of industry volumes in
2006, compared with approximately 60% in 2005. We believe that replacement sales will be
driven by camera phones, 3G/WCDMA devices, smartphones, continued penetration of color
displays, music features, mobile multimedia services and general aesthetic trends. According to our
estimates the global 3G/WCDMA market totaled 44 million units in 2005 and we believe that it will
at least double in 2006. We believe that the global mobile subscriber base reached approximately
2.2 billion at the end of 2005, and we estimate that this figure will reach 3 billion during 2008.
Our target is to continue to lower our mobile device R&D expenses/net sales ratio to 8% by the
end of 2006, while simultaneously ensuring that the most compelling products are brought to
market at the right time.
Infrastructure
Our Networks business group drives our infrastructure net sales by providing network
infrastructure, communications and networks service platforms, as well as professional services to
operators and service providers. Nokia’s Enterprise Solutions business group also provides a
variety of interoperable corporate infrastructure products, as discussed in the last paragraph of
this section. A number of factors affect the sales and profitability of our infrastructure business,
some of which are to a certain extent outside of our control.
Networks’ net sales depend on the mobile infrastructure market driven by network operator
investments. In low penetration markets, the principal factor influencing operator investments is
the growth in mobile usage and the growth in number of subscribers. This growth in turn leads
to increased demand for mobile network infrastructure as operators seek to build networks and
launch commercial services to meet coverage and capacity requirements. In low penetration
markets, where most networks currently use 2G technology, competition among suppliers is
driven by price, the ability to provide networks and services designed for low total cost of
ownership, and the ability to roll-out and support mobile networks. Investments by network
operators in low penetration markets may also depend on regulatory developments, such as the
availability, number and cost of telecommunications licenses. 3G/WCDMA deployment plans may
also have an impact on the size and speed of operators’ 2G investments.
In more developed markets, operator investments are driven primarily by the decision to expand
the capacity of existing networks or upgrade them in order to incorporate new technologies, such
as 3G/WCDMA, and next generation core. The demand for and commercial acceptance of such new
technologies is largely dependent upon the attractiveness of related services, the pricing of 3G
mobile devices, and the further maturity of 3G technologies as well as local regulation. In 3G,
vendors compete on the basis of price, track record of network implementations, and which future
technologies they plan to offer and when.
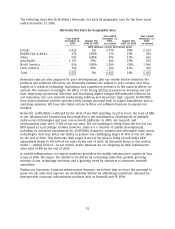
In 2005, according to our estimates, the value of the mobile infrastructure market increased
approximately 10% from 2004, while in 2004 it increased by approximately 14% from 2003 in
euro terms. Subscriber growth combined with increased voice usage in some markets has been
the main driver for the 2005 market growth. Investments in 3G also contributed positively to
market growth in Western Europe, Asia-Pacific and the US.
The following chart sets forth the global mobile infrastructure market size by geographic area,
based on Nokia’s estimates, for the three years ended December 31, 2005. Nokia’s estimate of the
value of the mobile infrastructure market includes sales of mobile infrastructure equipment and
related services for all cellular standards.
49