Nokia 2005 Annual Report Download - page 106
Download and view the complete annual report
Please find page 106 of the 2005 Nokia annual report below. You can navigate through the pages in the report by either clicking on the pages listed below, or by using the keyword search tool below to find specific information within the annual report.-
 1
1 -
2
-
3
-
4
-
5
-
6
-
7
-
8
-
9
-
10
-
11
-
12
-
13
-
14
-
15
-
16
-
17
-
18
-
19
-
20
-
21
-
22
-
23
-
24
-
25
-
26
-
27
-
28
-
29
-
30
-
31
-
32
-
33
-
34
-
35
-
36
-
37
-
38
-
39
-
40
-
41
-
42
-
43
-
44
-
45
-
46
-
47
-
48
-
49
-
50
-
51
-
52
-
53
-
54
-
55
-
56
-
57
-
58
-
59
-
60
-
61
-
62
-
63
-
64
-
65
-
66
-
67
-
68
-
69
-
70
-
71
-
72
-
73
-
74
-
75
-
76
-
77
-
78
-
79
-
80
-
81
-
82
-
83
-
84
-
85
-
86
-
87
-
88
-
89
-
90
-
91
-
92
-
93
-
94
-
95
-
 96
96 -
 97
97 -
 98
98 -
 99
99 -
 100
100 -
 101
101 -
 102
102 -
 103
103 -
 104
104 -
 105
105 -
 106
106 -
 107
107 -
 108
108 -
 109
109 -
 110
110 -
 111
111 -
 112
112 -
 113
113 -
 114
114 -
 115
115 -
 116
116 -
117
-
118
-
119
-
120
-
121
-
122
-
123
-
124
-
125
-
126
-
127
-
128
-
129
-
130
-
131
-
132
-
133
-
134
-
135
-
136
-
137
-
138
-
139
-
140
-
141
-
142
-
143
-
144
-
145
-
146
-
147
-
148
-
149
-
150
-
151
-
152
-
153
-
154
-
155
-
156
-
157
-
158
-
159
-
160
-
161
-
162
-
163
-
164
-
165
-
166
-
167
-
168
-
169
-
170
-
171
-
172
-
173
-
174
-
175
-
176
-
177
-
178
-
179
-
180
-
181
-
182
-
183
-
184
-
185
-
186
-
187
-
188
-
189
-
190
-
191
-
192
-
193
-
194
-
195
-
196
-
197
-
198
-
199
-
200
-
201
-
202
-
203
-
204
-
205
-
206
-
207
-
208
-
209
-
210
-
211
-
212
-
213
-
214
-
215
-
216
-
217
-
218
-
219
-
220
-
221
-
222
-
223
-
224
-
225
-
226
-
227
 |
 |

Shares.’’ For a description of our equity-based compensation programs for employees and
management, see ‘‘Item 6.B Compensation—Equity-based compensation programs.’’
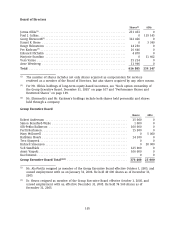
Daniel R. Hesse and Edouard Michelin were elected as new members to the Board of Directors by
the Annual General Meeting on April 7, 2005.
Of the Group Executive Board members, Sari Baldauf and J.T. Bergqvist ceased employment with us
and resigned from the Group Executive Board with effect from January 31, 2005. Pekka Ala-Pietil¨
a
and Yrj¨
o Neuvo resigned from the Group Executive Board with effect from October 1, 2005.
Ala-Pietil¨
a served as Executive Advisor for Nokia from October 1, 2005 until January 31, 2006,
while Yrj¨
o Neuvo retired at the end of 2005.
The following persons were appointed as new members to the Group Executive Board effective in
2005: Tero Ojanper¨
a was appointed a member with effect from January 1, 2005, Simon Beresford-
Wylie from February 1, 2005, Robert Andersson and Kai ¨
Oist¨
am¨
o effective October 1, 2005.
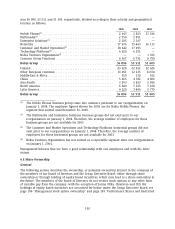
On December 31, 2005, the members of our Board of Directors held the aggregate of 750 952
shares and ADS’s in the company, which represented 0.018% of our outstanding share capital and
total voting rights excluding shares held by the Group as of that date. The following table depicts
the share ownership as well as other potential ownership interests in the company based on
long-term equity incentives of the members of our Group Executive Board, in relation to the
company’s outstanding share capital and total voting rights as of December 31, 2005.
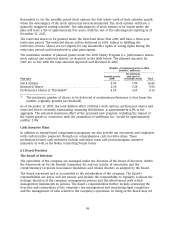
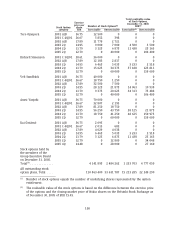
Group Executive Board, ownership of shares and equity-based incentives, December 31, 2005
Performance
Stock Shares at Restricted
Shares %(1) Options %(2) Threshold(3) %(2) Shares %(2)
Group Executive Board . . 632 833 0.015 6 626 157 4.586 418 800 5.207 923 000 17.799
Other employees ....... * * 137869030
(4) 95.414 7 624 017 94.793 4 262 676 82.201
Total ............... 144 495 187 100 8 042 817 100 5 185 676 100
(1) The percentage is calculated in relation to the outstanding share capital and total voting rights of the
company as of December 31, 2005, excluding shares held by the Group as of that date.
(2) The percentage is calculated in relation to the total outstanding equity plans, i.e. stock options,
performance shares and restricted shares, as applicable, as of December 31, 2005.
(3) Performance shares at threshold represent the original grant. At maximum performance, the settlement
amounts to four times the number of performance shares originally granted (at threshold).
(4) The number includes the total number of stock options outstanding, consisting of 128 091 354 options
held by other employees and 9 777 676 options sold to the market.
*no information available.
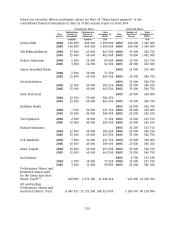
Shares
The following two tables set forth the number of shares and ADSs beneficially held by members of
the Board of Directors and the Group Executive Board as of December 31, 2005.
104