Nokia 2005 Annual Report Download - page 213
Download and view the complete annual report
Please find page 213 of the 2005 Nokia annual report below. You can navigate through the pages in the report by either clicking on the pages listed below, or by using the keyword search tool below to find specific information within the annual report.-
 1
1 -
2
-
3
-
4
-
5
-
6
-
7
-
8
-
9
-
10
-
11
-
12
-
13
-
14
-
15
-
16
-
17
-
18
-
19
-
20
-
21
-
22
-
23
-
24
-
25
-
26
-
27
-
28
-
29
-
30
-
31
-
32
-
33
-
34
-
35
-
36
-
37
-
38
-
39
-
40
-
41
-
42
-
43
-
44
-
45
-
46
-
47
-
48
-
49
-
50
-
51
-
52
-
53
-
54
-
55
-
56
-
57
-
58
-
59
-
60
-
61
-
62
-
63
-
64
-
65
-
66
-
67
-
68
-
69
-
70
-
71
-
72
-
73
-
74
-
75
-
76
-
77
-
78
-
79
-
80
-
81
-
82
-
83
-
84
-
85
-
86
-
87
-
88
-
89
-
90
-
91
-
92
-
93
-
94
-
95
-
96
-
97
-
98
-
99
-
100
-
101
-
102
-
103
-
104
-
105
-
106
-
107
-
108
-
109
-
110
-
111
-
112
-
113
-
114
-
115
-
116
-
117
-
118
-
119
-
120
-
121
-
122
-
123
-
124
-
125
-
126
-
127
-
128
-
129
-
130
-
131
-
132
-
133
-
134
-
135
-
136
-
137
-
138
-
139
-
140
-
141
-
142
-
143
-
144
-
145
-
146
-
147
-
148
-
149
-
150
-
151
-
152
-
153
-
154
-
155
-
156
-
157
-
158
-
159
-
160
-
161
-
162
-
163
-
164
-
165
-
166
-
167
-
168
-
169
-
170
-
171
-
172
-
173
-
174
-
175
-
176
-
177
-
178
-
179
-
180
-
181
-
182
-
183
-
184
-
185
-
186
-
187
-
188
-
189
-
190
-
191
-
192
-
193
-
194
-
195
-
196
-
197
-
198
-
199
-
200
-
201
-
202
-
 203
203 -
 204
204 -
 205
205 -
 206
206 -
 207
207 -
 208
208 -
 209
209 -
 210
210 -
 211
211 -
 212
212 -
 213
213 -
 214
214 -
 215
215 -
 216
216 -
 217
217 -
 218
218 -
 219
219 -
 220
220 -
 221
221 -
 222
222 -
 223
223 -
224
-
225
-
226
-
227
 |
 |
Notes to the Consolidated Financial Statements (Continued)
39. Differences between International Financial Reporting Standards and US Generally
Accepted Accounting Principles (Continued)
mechanical components include covers, connectors, key mats and antennas. Software includes
various third-party software that enables various new features and applications to be added, like
third-party e-mail, into our products. In addition, a particular component may be available only
from a limited number of suppliers. Suppliers may from time to time extend lead times, limit
supplies or increase prices due to capacity constraints or other factors, which could adversely
affect our ability to deliver our products and solutions on a timely basis. Moreover, a component
supplier may fail to meet our supplier requirements, such as, most notably, our and our
customers’ product quality, safety, security and other standards, and consequently some of our
products may be unacceptable to us and our customers, or may fail to meet our own quality
controls. In addition, a component supplier may experience delays or disruption to its
manufacturing processes or financial difficulties. Any of these events could delay our successful
delivery of products and solutions that meet our and our customers’ quality, safety, security and
other requirements, or otherwise adversely affect our sales and our results of operations.
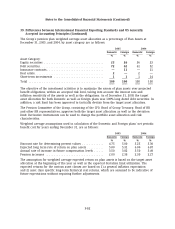
Segment information
The accounting policies of the segments are the same as those described in Note 1, Accounting
principles. Nokia accounts for intersegment revenues and transfers as if the revenues or transfers
were to third parties, and therefore at current market prices. Nokia evaluates the performance of
its segments and allocates resources to them based on operating profit.
Under IFRS, segment assets and liabilities of the horizontal groups are allocated to business groups
on a symmetrical basis. Under US GAAP, segment assets and liabilities are reported on the basis of
the internal reporting structure reflecting management reporting.
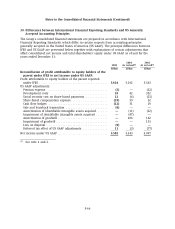
Assets on an IFRS basis, as reported under FAS 131 as at December 31, 2005 for Mobile Phones,
Multimedia, Enterprise Solutions and Networks were EUR 2,525 million (EUR 2,192 million in
2004), EUR 920 million (EUR 533 million in 2004), EUR 133 million (EUR 163 million in 2004) and
EUR 3,437 million (EUR 3,055 million in 2004), respectively. Liabilities on an IFRS basis as reported
under FAS 131 as at December 31, 2005 for Mobile Phones, Multimedia, Enterprise Solutions and
Networks were EUR 1,775 million (EUR 2,668 million in 2004), EUR 1,314 million (EUR 701 million
in 2004), EUR 276 million (EUR 230 million in 2004) and EUR 1,775 million (EUR 1,574 million in
2004), respectively. Assets and liabilities included in Common Group Functions as at December 31,
F-75