Nokia 2005 Annual Report Download - page 70
Download and view the complete annual report
Please find page 70 of the 2005 Nokia annual report below. You can navigate through the pages in the report by either clicking on the pages listed below, or by using the keyword search tool below to find specific information within the annual report.-
 1
1 -
 2
2 -
 3
3 -
 4
4 -
 5
5 -
 6
6 -
 7
7 -
 8
8 -
 9
9 -
 10
10 -
 11
11 -
 12
12 -
 13
13 -
 14
14 -
 15
15 -
 16
16 -
 17
17 -
 18
18 -
 19
19 -
 20
20 -
 21
21 -
 22
22 -
 23
23 -
 24
24 -
 25
25 -
 26
26 -
 27
27 -
 28
28 -
 29
29 -
 30
30 -
 31
31 -
 32
32 -
 33
33 -
 34
34 -
 35
35 -
 36
36 -
 37
37 -
 38
38 -
 39
39 -
 40
40 -
 41
41 -
 42
42 -
 43
43 -
 44
44 -
 45
45 -
 46
46 -
 47
47 -
 48
48 -
 49
49 -
 50
50 -
 51
51 -
 52
52 -
 53
53 -
 54
54 -
 55
55 -
 56
56 -
 57
57 -
 58
58 -
 59
59 -
 60
60 -
 61
61 -
 62
62 -
 63
63 -
 64
64 -
 65
65 -
 66
66 -
 67
67 -
 68
68 -
 69
69 -
 70
70 -
 71
71 -
 72
72 -
 73
73 -
 74
74 -
 75
75 -
 76
76 -
 77
77 -
 78
78 -
 79
79 -
 80
80 -
 81
81 -
 82
82 -
 83
83 -
 84
84 -
 85
85 -
 86
86 -
 87
87 -
 88
88 -
 89
89 -
 90
90 -
 91
91 -
 92
92 -
 93
93 -
 94
94 -
 95
95 -
 96
96 -
 97
97 -
 98
98 -
 99
99 -
 100
100 -
 101
101 -
 102
102 -
 103
103 -
 104
104 -
 105
105 -
 106
106 -
 107
107 -
 108
108 -
 109
109 -
 110
110 -
 111
111 -
 112
112 -
 113
113 -
 114
114 -
 115
115 -
 116
116 -
 117
117 -
 118
118 -
 119
119 -
 120
120 -
 121
121 -
 122
122 -
 123
123 -
 124
124 -
 125
125 -
 126
126 -
 127
127 -
 128
128 -
 129
129 -
 130
130 -
 131
131 -
 132
132 -
 133
133 -
 134
134 -
 135
135 -
 136
136 -
 137
137 -
 138
138 -
 139
139 -
 140
140 -
 141
141 -
 142
142 -
 143
143 -
 144
144 -
 145
145 -
 146
146 -
 147
147 -
 148
148 -
 149
149 -
 150
150 -
 151
151 -
 152
152 -
 153
153 -
 154
154 -
 155
155 -
 156
156 -
 157
157 -
 158
158 -
 159
159 -
 160
160 -
 161
161 -
 162
162 -
 163
163 -
 164
164 -
 165
165 -
 166
166 -
 167
167 -
 168
168 -
 169
169 -
 170
170 -
 171
171 -
 172
172 -
 173
173 -
 174
174 -
 175
175 -
 176
176 -
 177
177 -
 178
178 -
 179
179 -
 180
180 -
 181
181 -
 182
182 -
 183
183 -
 184
184 -
 185
185 -
 186
186 -
 187
187 -
 188
188 -
 189
189 -
 190
190 -
 191
191 -
 192
192 -
 193
193 -
 194
194 -
 195
195 -
 196
196 -
 197
197 -
 198
198 -
 199
199 -
 200
200 -
 201
201 -
 202
202 -
 203
203 -
 204
204 -
 205
205 -
 206
206 -
 207
207 -
 208
208 -
 209
209 -
 210
210 -
 211
211 -
 212
212 -
 213
213 -
 214
214 -
 215
215 -
 216
216 -
 217
217 -
 218
218 -
 219
219 -
 220
220 -
 221
221 -
 222
222 -
 223
223 -
 224
224 -
 225
225 -
 226
226 -
 227
227
 |
 |

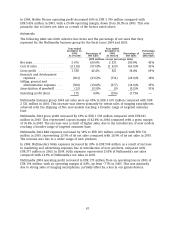
Enterprise Solutions
The following table sets forth selective line items and the percentage of net sales that they
represent for the Enterprise Solutions business group for the fiscal years 2004 and 2003.
Year ended Year ended
December 31, December 31, Percentage
2004 Percentage of 2003 Percentage of Increase/
As revised Net Sales As revised Net Sales (decrease)
(EUR millions, except percentage data)
Net sales .................. 839 100.0% 540 100.0% 55%
Cost of sales ................ (475) (56.6)% (288) (53.3)% 65%
Gross profit ................ 364 43.4% 252 46.7% 44%
Research and development
expenses ................. (304) (36.2)% (239) (44.3)% 27%
Selling, general and
administrative expenses .... (264) (31.5)% (153) (28.3)% 73%
Amortization of goodwill ..... (6) (0.7)% (3) (0.6)% 100%
Operating loss .............. (210) (25.0)% (143) (26.5)% 47%
Enterprise Solutions business group 2004 net sales grew 55% to EUR 839 million compared with
EUR 540 million in 2003 primarily as a result of increased sales of business-focused mobile
devices.
In Enterprise Solutions gross profit increased by 44% to EUR 364 million due to higher sales,
compared with EUR 252 million in 2003. This represented a gross margin of 43.4% in 2004
compared with a gross margin of 46.7% in 2003.
In Enterprise Solutions R&D expenses increased by 27% to EUR 304 million due to wider range of
new products compared with 2003 (EUR 239 million) representing 36.2% of its net sales (44.3% of
its net sales compared with 2003).
In 2004, Enterprise Solutions SG&A expenses increased by 73% to EUR 264 million as a result of
increase in marketing and advertising expenses due to introduction of new products, compared
with EUR 153 million in 2003. In 2004 SG&A expenses represented 31.5% of Enterprise Solutions
net sales (28.3% of Enterprise Solutions net sales compared with 2003).
Enterprise Solutions operating loss increased 47% to EUR 210 million in 2004 compared with a
loss of EUR 143 million in 2003, with an operating margin of -25.0%, compared with an operating
margin of -26.5% in 2003. The operating loss was in line with our expectations.
68
