Nokia 2005 Annual Report Download - page 49
Download and view the complete annual report
Please find page 49 of the 2005 Nokia annual report below. You can navigate through the pages in the report by either clicking on the pages listed below, or by using the keyword search tool below to find specific information within the annual report.-
 1
1 -
2
-
3
-
4
-
5
-
6
-
7
-
8
-
9
-
10
-
11
-
12
-
13
-
14
-
15
-
16
-
17
-
18
-
19
-
20
-
21
-
22
-
23
-
24
-
25
-
26
-
27
-
28
-
29
-
30
-
31
-
32
-
33
-
34
-
35
-
36
-
37
-
38
-
 39
39 -
 40
40 -
 41
41 -
 42
42 -
 43
43 -
 44
44 -
 45
45 -
 46
46 -
 47
47 -
 48
48 -
 49
49 -
 50
50 -
 51
51 -
 52
52 -
 53
53 -
 54
54 -
 55
55 -
 56
56 -
 57
57 -
 58
58 -
 59
59 -
60
-
61
-
62
-
63
-
64
-
65
-
66
-
67
-
68
-
69
-
70
-
71
-
72
-
73
-
74
-
75
-
76
-
77
-
78
-
79
-
80
-
81
-
82
-
83
-
84
-
85
-
86
-
87
-
88
-
89
-
90
-
91
-
92
-
93
-
94
-
95
-
96
-
97
-
98
-
99
-
100
-
101
-
102
-
103
-
104
-
105
-
106
-
107
-
108
-
109
-
110
-
111
-
112
-
113
-
114
-
115
-
116
-
117
-
118
-
119
-
120
-
121
-
122
-
123
-
124
-
125
-
126
-
127
-
128
-
129
-
130
-
131
-
132
-
133
-
134
-
135
-
136
-
137
-
138
-
139
-
140
-
141
-
142
-
143
-
144
-
145
-
146
-
147
-
148
-
149
-
150
-
151
-
152
-
153
-
154
-
155
-
156
-
157
-
158
-
159
-
160
-
161
-
162
-
163
-
164
-
165
-
166
-
167
-
168
-
169
-
170
-
171
-
172
-
173
-
174
-
175
-
176
-
177
-
178
-
179
-
180
-
181
-
182
-
183
-
184
-
185
-
186
-
187
-
188
-
189
-
190
-
191
-
192
-
193
-
194
-
195
-
196
-
197
-
198
-
199
-
200
-
201
-
202
-
203
-
204
-
205
-
206
-
207
-
208
-
209
-
210
-
211
-
212
-
213
-
214
-
215
-
216
-
217
-
218
-
219
-
220
-
221
-
222
-
223
-
224
-
225
-
226
-
227
 |
 |

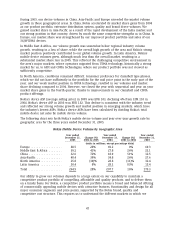
During 2005, our device volumes in China, Asia-Pacific and Europe exceeded the market volume
growth in those geographical areas. In China, Nokia accelerated its market share gains from 2004
as our product portfolio, extensive distribution system, quality and brand drove volumes. We
gained market share in Asia-Pacific as a result of the rapid development of the India market and
our strong position in that country, driven by much the same competitive strengths as in China. In
Europe, our market share was strengthened by our improved product portfolio and sales of our
3G/WCDMA devices.
In Middle East & Africa, our volume growth was somewhat below regional industry volume
growth, resulting in a loss of share, while the overall high growth of the area and Nokia’s strong
market position positively contributed to our global volume growth. In Latin America, Nokia’s
mobile device volumes grew, although much less than the overall market, resulting in a
substantial market share loss in 2005. This reflected the challenging competitive environment in
the area’s major markets, where operators migrated from TDMA technology, historically a strong
market for us, to GSM and CDMA technologies, where our product portfolio was not viewed as
sufficiently competitive.
In North America, conditions remained difficult. Consumer preference for clamshell type phones,
which we did not have sufficiently in the portfolio for the mid price point in the early part of the
year, and our weak market position in CDMA technology, resulted in our volumes and market
share declining compared to 2004. However, we closed the year with sequential and year on year
market share gains in the fourth quarter, thanks to improvements in our clamshell and CDMA
product offerings.
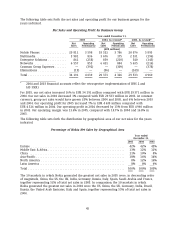
Nokia’s device ASP (average selling price) in 2005 was EUR 103, declining 6% from EUR 110 in
2004. Nokia’s device ASP in 2003 was EUR 132. This decline is consistent with the industry trend
and reflected our strong volume growth and market position in emerging markets, which have
the industry’s lowest ASPs. Nokia’s device ASPs have been calculated by dividing Nokia’s total
mobile device net sales by mobile device volume.
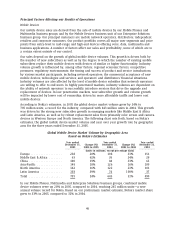
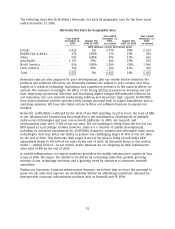
The following chart sets forth Nokia’s mobile device volume and year over year growth rate by
geographic area for the three years ended December 31, 2005.
Nokia Mobile Device Volume by Geographic Area
Year ended Year ended Year ended
December 31, Change (%) December 31, Change (%) December 31,
2005 2004 to 2005 2004 2003 to 2004 2003
(units in millions, except percentage data)
Europe ................... 88.5 28% 69.2 0% 69.3
Middle East & Africa ........ 39.2 41% 27.8 26% 22.1
China .................... 32.6 72% 18.9 51% 12.5
Asia-Pacific ............... 48.4 39% 34.8 26% 27.6
North America ............. 25.8 (10)% 28.8 (11)% 32.4
Latin America ............. 30.4 8% 28.2 83% 15.4
Total .................... 264.9 28% 207.7 16% 179.3
Our ability to grow our volumes depends to a large extent on our capability to maintain a
competitive product portfolio of compelling, affordable and quality products, and to deliver them
on a timely basis. For Nokia, a competitive product portfolio means a broad and balanced offering
of commercially appealing mobile devices with attractive features, functionality and design for all
major consumer segments and price points, supported by the Nokia brand, quality and
competitive cost structure. This requires us to understand the different markets in which we
47