Nokia 2005 Annual Report Download - page 53
Download and view the complete annual report
Please find page 53 of the 2005 Nokia annual report below. You can navigate through the pages in the report by either clicking on the pages listed below, or by using the keyword search tool below to find specific information within the annual report.-
 1
1 -
2
-
3
-
4
-
5
-
6
-
7
-
8
-
9
-
10
-
11
-
12
-
13
-
14
-
15
-
16
-
17
-
18
-
19
-
20
-
21
-
22
-
23
-
24
-
25
-
26
-
27
-
28
-
29
-
30
-
31
-
32
-
33
-
34
-
35
-
36
-
37
-
38
-
39
-
40
-
41
-
42
-
 43
43 -
 44
44 -
 45
45 -
 46
46 -
 47
47 -
 48
48 -
 49
49 -
 50
50 -
 51
51 -
 52
52 -
 53
53 -
 54
54 -
 55
55 -
 56
56 -
 57
57 -
 58
58 -
 59
59 -
 60
60 -
 61
61 -
 62
62 -
 63
63 -
64
-
65
-
66
-
67
-
68
-
69
-
70
-
71
-
72
-
73
-
74
-
75
-
76
-
77
-
78
-
79
-
80
-
81
-
82
-
83
-
84
-
85
-
86
-
87
-
88
-
89
-
90
-
91
-
92
-
93
-
94
-
95
-
96
-
97
-
98
-
99
-
100
-
101
-
102
-
103
-
104
-
105
-
106
-
107
-
108
-
109
-
110
-
111
-
112
-
113
-
114
-
115
-
116
-
117
-
118
-
119
-
120
-
121
-
122
-
123
-
124
-
125
-
126
-
127
-
128
-
129
-
130
-
131
-
132
-
133
-
134
-
135
-
136
-
137
-
138
-
139
-
140
-
141
-
142
-
143
-
144
-
145
-
146
-
147
-
148
-
149
-
150
-
151
-
152
-
153
-
154
-
155
-
156
-
157
-
158
-
159
-
160
-
161
-
162
-
163
-
164
-
165
-
166
-
167
-
168
-
169
-
170
-
171
-
172
-
173
-
174
-
175
-
176
-
177
-
178
-
179
-
180
-
181
-
182
-
183
-
184
-
185
-
186
-
187
-
188
-
189
-
190
-
191
-
192
-
193
-
194
-
195
-
196
-
197
-
198
-
199
-
200
-
201
-
202
-
203
-
204
-
205
-
206
-
207
-
208
-
209
-
210
-
211
-
212
-
213
-
214
-
215
-
216
-
217
-
218
-
219
-
220
-
221
-
222
-
223
-
224
-
225
-
226
-
227
 |
 |

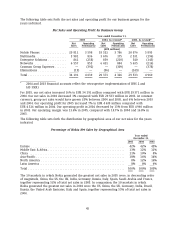
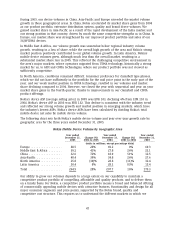
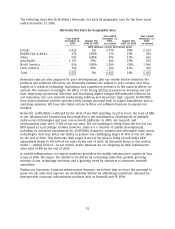
The following chart sets forth Nokia’s Networks’ net sales by geographic area for the three years
ended December 31, 2005.
Networks Net Sales by Geographic Area
Year ended Year ended
Year ended December 31, December 31,
December 31, Change (%) 2004, Change (%) 2003,
2005 2004 to 2005 As revised 2003 to 2004 As revised
(EUR millions, except percentage data)
Europe ................... 2 813 1% 2 774 10% 2 519
Middle East & Africa ........ 274 (13)% 316 23% 256
China .................... 695 (20)% 872 31% 666
Asia-Pacific ............... 1 197 27% 942 23% 765
North America ............. 816 (19)% 1 008 (5)% 1 060
Latin America ............. 762 47% 520 41% 369
Total .................... 6 557 2% 6 432 14% 5 635
Networks sales are also impacted by price developments. Like our mobile devices business, the
products and solutions offered by our Networks business are subject to price erosion over time,
largely as a result of technology maturation and competitive pressures in the markets where we
operate. We endeavor to mitigate the effect of the strong pricing pressures by lowering our cost
base, improving operational efficiency and developing higher margin differentiated solutions for
our customers. Our core network modernizing solution and innovative high capacity 3G/WCDMA
base station platform provide operators with savings potential both in capital expenditure and in
operating expenses. We have also taken actions to drive our software business to expand our
margins.
Networks’ profitability is affected by the level of our R&D spending. In prior years, the level of R&D
in our infrastructure business has been high due to the simultaneous development of multiple
radio access technologies and new core network platforms. In 2005, our research and
developments costs were 17.8% of our net sales. We are targeting to bring down the level of our
R&D spend as a percentage of sales, however, there are a number of market developments,
including an increased requirement for 3G/WCDMA frequency variants and alternative radio access
technologies, that may affect our ability to achieve our challenging target of 14% of our net sales
by the end of 2006. This Networks’ R&D target is part of the plan to bring overall Nokia R&D
expenditure down to 9%-10% of net sales by the end of 2006. As discussed above in this section
under ‘‘—Mobile Devices’’, in our mobile device business we are targeting an R&D expenses/net
sales ratio of 8% by the end of 2006.
In mobile infrastructure, we expect moderate growth in the mobile infrastructure market in euro
terms in 2006. We expect the market to be driven by continuing subscriber growth, growing
minutes of use, technology evolution and a growing trend by operators to outsource network
operations.
Within our Enterprise Solutions infrastructure business, we believe that we have the potential to
grow our net sales and improve our profitability further by addressing enterprises’ demand for
interoperable corporate infrastructure products such as firewalls and IP VPNs.
51