Nokia 2005 Annual Report Download - page 182
Download and view the complete annual report
Please find page 182 of the 2005 Nokia annual report below. You can navigate through the pages in the report by either clicking on the pages listed below, or by using the keyword search tool below to find specific information within the annual report.-
 1
1 -
2
-
3
-
4
-
5
-
6
-
7
-
8
-
9
-
10
-
11
-
12
-
13
-
14
-
15
-
16
-
17
-
18
-
19
-
20
-
21
-
22
-
23
-
24
-
25
-
26
-
27
-
28
-
29
-
30
-
31
-
32
-
33
-
34
-
35
-
36
-
37
-
38
-
39
-
40
-
41
-
42
-
43
-
44
-
45
-
46
-
47
-
48
-
49
-
50
-
51
-
52
-
53
-
54
-
55
-
56
-
57
-
58
-
59
-
60
-
61
-
62
-
63
-
64
-
65
-
66
-
67
-
68
-
69
-
70
-
71
-
72
-
73
-
74
-
75
-
76
-
77
-
78
-
79
-
80
-
81
-
82
-
83
-
84
-
85
-
86
-
87
-
88
-
89
-
90
-
91
-
92
-
93
-
94
-
95
-
96
-
97
-
98
-
99
-
100
-
101
-
102
-
103
-
104
-
105
-
106
-
107
-
108
-
109
-
110
-
111
-
112
-
113
-
114
-
115
-
116
-
117
-
118
-
119
-
120
-
121
-
122
-
123
-
124
-
125
-
126
-
127
-
128
-
129
-
130
-
131
-
132
-
133
-
134
-
135
-
136
-
137
-
138
-
139
-
140
-
141
-
142
-
143
-
144
-
145
-
146
-
147
-
148
-
149
-
150
-
151
-
152
-
153
-
154
-
155
-
156
-
157
-
158
-
159
-
160
-
161
-
162
-
163
-
164
-
165
-
166
-
167
-
168
-
169
-
170
-
171
-
 172
172 -
 173
173 -
 174
174 -
 175
175 -
 176
176 -
 177
177 -
 178
178 -
 179
179 -
 180
180 -
 181
181 -
 182
182 -
 183
183 -
 184
184 -
 185
185 -
 186
186 -
 187
187 -
 188
188 -
 189
189 -
 190
190 -
 191
191 -
 192
192 -
193
-
194
-
195
-
196
-
197
-
198
-
199
-
200
-
201
-
202
-
203
-
204
-
205
-
206
-
207
-
208
-
209
-
210
-
211
-
212
-
213
-
214
-
215
-
216
-
217
-
218
-
219
-
220
-
221
-
222
-
223
-
224
-
225
-
226
-
227
 |
 |

Notes to the Consolidated Financial Statements (Continued)
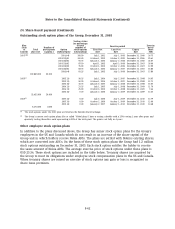
24. Share-based payment (Continued)
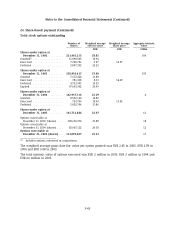
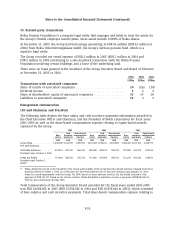
The options outstanding by range of exercise price at December 31, 2005 are as follows:
Options outstanding Vested options outstanding
Weighted average Weighted Weighted
remaining Weighted average remaining average
Exercise prices Number of contractual exercise price Number of contractual exercise price
EUR shares life in years EUR shares life in years EUR
0.56 - 14.48 ............ 15,404,732 2.89 12.24 2,631,467 1.81 11.13
14.95 - 17.72 ........... 27,034,385 1.23 14.96 15,136,134 0.59 14.96
17.89 ................ 44,820,871 0.60 17.89 37,025,490 0.50 17.89
18.63 - 36.49 ........... 19,557,612 0.38 26.65 18,388,030 0.38 26.65
36.75 - 47.14 ........... 38,914,286 0.40 36.77 38,914,286 0.40 36.77
145,731,886 112,095,407
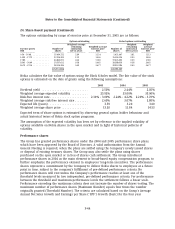
Nokia calculates the fair value of options using the Black Scholes model. The fair value of the stock
options is estimated on the date of grants using the following assumptions:
2005 2004 2003
Dividend yield ............................ 2.50% 2.44% 2.05%
Weighted average expected volatility .......... 25.92% 33.00% 35.00%
Risk-free interest rate ....................... 2.16% - 3.09% 2.24% - 4.22% 2.20% - 3.70%
Weighted average risk-free interest rate ........ 2.60% 3.07% 2.80%
Expected life (years) ........................ 3.59 3.20 3.60
Weighted average share price ................ 13.20 11.84 14.53
Expected term of share options is estimated by observing general option holder behaviour and
actual historical terms of Nokia stock option programs.
The assumption of the expected volatility has been set by reference to the implied volatility of
options available on Nokia shares in the open market and in light of historical patterns of
volatility.
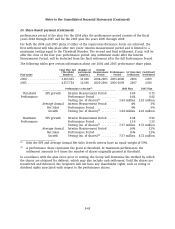
Performance shares
The Group has granted performance shares under the 2004 and 2005 performance share plans,
which have been approved by the Board of Directors. A valid authorization from the Annual
General Meeting is required, when the plans are settled using the Company’s newly issued shares
or disposal of existing treasury shares. The Group may also settle the plans using shares
purchased on the open market or in lieu of shares cash settlement. The Group introduced
performance shares in 2004 as the main element to broad-based equity compensation program, to
further emphasize the performance element in employees’ long-term incentives. The performance
shares represent a commitment by the Company to deliver Nokia shares to employees at a future
point in time, subject to the company’s fulfillment of pre-defined performance criteria. No
performance shares will vest unless the Company’s performance reaches at least one of the
threshold levels measured by two independent, pre-defined performance criteria. For performance
between the threshold and maximum performance levels the settlement follows a linear scale.
Performance exceeding the maximum criteria does not increase the number of shares vesting. The
maximum number of performance shares (Maximum Number) equals four times the number
originally granted (Threshold Number). The criteria are calculated based on the Group’s Average
Annual Net Sales Growth and Earnings per Share (‘‘EPS’’) Growth (basic) for the four year
F-44