Nokia 2005 Annual Report Download - page 127
Download and view the complete annual report
Please find page 127 of the 2005 Nokia annual report below. You can navigate through the pages in the report by either clicking on the pages listed below, or by using the keyword search tool below to find specific information within the annual report.-
 1
1 -
2
-
3
-
4
-
5
-
6
-
7
-
8
-
9
-
10
-
11
-
12
-
13
-
14
-
15
-
16
-
17
-
18
-
19
-
20
-
21
-
22
-
23
-
24
-
25
-
26
-
27
-
28
-
29
-
30
-
31
-
32
-
33
-
34
-
35
-
36
-
37
-
38
-
39
-
40
-
41
-
42
-
43
-
44
-
45
-
46
-
47
-
48
-
49
-
50
-
51
-
52
-
53
-
54
-
55
-
56
-
57
-
58
-
59
-
60
-
61
-
62
-
63
-
64
-
65
-
66
-
67
-
68
-
69
-
70
-
71
-
72
-
73
-
74
-
75
-
76
-
77
-
78
-
79
-
80
-
81
-
82
-
83
-
84
-
85
-
86
-
87
-
88
-
89
-
90
-
91
-
92
-
93
-
94
-
95
-
96
-
97
-
98
-
99
-
100
-
101
-
102
-
103
-
104
-
105
-
106
-
107
-
108
-
109
-
110
-
111
-
112
-
113
-
114
-
115
-
116
-
 117
117 -
 118
118 -
 119
119 -
 120
120 -
 121
121 -
 122
122 -
 123
123 -
 124
124 -
 125
125 -
 126
126 -
 127
127 -
 128
128 -
 129
129 -
 130
130 -
 131
131 -
 132
132 -
 133
133 -
 134
134 -
 135
135 -
 136
136 -
 137
137 -
138
-
139
-
140
-
141
-
142
-
143
-
144
-
145
-
146
-
147
-
148
-
149
-
150
-
151
-
152
-
153
-
154
-
155
-
156
-
157
-
158
-
159
-
160
-
161
-
162
-
163
-
164
-
165
-
166
-
167
-
168
-
169
-
170
-
171
-
172
-
173
-
174
-
175
-
176
-
177
-
178
-
179
-
180
-
181
-
182
-
183
-
184
-
185
-
186
-
187
-
188
-
189
-
190
-
191
-
192
-
193
-
194
-
195
-
196
-
197
-
198
-
199
-
200
-
201
-
202
-
203
-
204
-
205
-
206
-
207
-
208
-
209
-
210
-
211
-
212
-
213
-
214
-
215
-
216
-
217
-
218
-
219
-
220
-
221
-
222
-
223
-
224
-
225
-
226
-
227
 |
 |

20FEB200617415963
Nokia has Treasury Centers in Geneva, Singapore/Beijing and Dallas/Sao Paolo, and a Corporate
Treasury unit in Espoo. This international organization enables Nokia to provide the Group
companies with financial services according to local needs and requirements.
The Treasury function is governed by policies approved by top management. Treasury Policy
provides principles for overall financial risk management and determines the allocation of
responsibilities for financial risk management in Nokia. Operating Policies cover specific areas such
as foreign exchange risk, interest rate risk, use of derivative financial instruments, as well as
liquidity and credit risk. Nokia is risk averse in its Treasury activities. Business Groups have
detailed Standard Operating Procedures supplementing the Treasury Policy in financial risk
management related issues.
Market risk
Foreign exchange risk
Nokia operates globally and is thus exposed to foreign exchange risk arising from various currency
combinations. Foreign currency denominated assets and liabilities together with expected cash
flows from highly probable purchases and sales give rise to foreign exchange exposures. These
transaction exposures are managed against various local currencies because of Nokia’s substantial
production and sales outside the Eurozone.
Due to the changes in the business environment, currency combinations may also change within
the financial year. The most significant non-euro sales currencies during the year were the
US dollar (USD), the Chinese yuan (CNY) and the UK pound sterling (GBP). In general, depreciation
of another currency relative to the euro has an adverse effect on Nokia’s sales and operating
profit, while appreciation of another currency has a positive effect, with the exception of Japanese
yen (JPY), being the only significant foreign currency in which Nokia has more purchase than
sales.
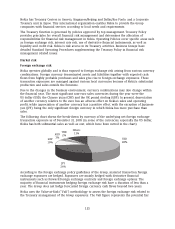
The following chart shows the break-down by currency of the underlying net foreign exchange
transaction exposure as of December 31, 2005 (in some of the currencies, especially the US dollar,
Nokia has both substantial sales as well as cost, which have been netted in the chart).
THB
2%
AUD
3%
GBP
10%
USD
48%
JPY
26%
Others
11%
According to the foreign exchange policy guidelines of the Group, material transaction foreign
exchange exposures are hedged. Exposures are mainly hedged with derivative financial
instruments such as forward foreign exchange contracts and foreign exchange options. The
majority of financial instruments hedging foreign exchange risk have a duration of less than a
year. The Group does not hedge forecasted foreign currency cash flows beyond two years.
Nokia uses the Value-at-Risk (‘‘VaR’’) methodology to assess the foreign exchange risk related to
the Treasury management of the Group exposures. The VaR figure represents the potential fair
125