Nokia 2005 Annual Report Download - page 173
Download and view the complete annual report
Please find page 173 of the 2005 Nokia annual report below. You can navigate through the pages in the report by either clicking on the pages listed below, or by using the keyword search tool below to find specific information within the annual report.-
 1
1 -
2
-
3
-
4
-
5
-
6
-
7
-
8
-
9
-
10
-
11
-
12
-
13
-
14
-
15
-
16
-
17
-
18
-
19
-
20
-
21
-
22
-
23
-
24
-
25
-
26
-
27
-
28
-
29
-
30
-
31
-
32
-
33
-
34
-
35
-
36
-
37
-
38
-
39
-
40
-
41
-
42
-
43
-
44
-
45
-
46
-
47
-
48
-
49
-
50
-
51
-
52
-
53
-
54
-
55
-
56
-
57
-
58
-
59
-
60
-
61
-
62
-
63
-
64
-
65
-
66
-
67
-
68
-
69
-
70
-
71
-
72
-
73
-
74
-
75
-
76
-
77
-
78
-
79
-
80
-
81
-
82
-
83
-
84
-
85
-
86
-
87
-
88
-
89
-
90
-
91
-
92
-
93
-
94
-
95
-
96
-
97
-
98
-
99
-
100
-
101
-
102
-
103
-
104
-
105
-
106
-
107
-
108
-
109
-
110
-
111
-
112
-
113
-
114
-
115
-
116
-
117
-
118
-
119
-
120
-
121
-
122
-
123
-
124
-
125
-
126
-
127
-
128
-
129
-
130
-
131
-
132
-
133
-
134
-
135
-
136
-
137
-
138
-
139
-
140
-
141
-
142
-
143
-
144
-
145
-
146
-
147
-
148
-
149
-
150
-
151
-
152
-
153
-
154
-
155
-
156
-
157
-
158
-
159
-
160
-
161
-
162
-
 163
163 -
 164
164 -
 165
165 -
 166
166 -
 167
167 -
 168
168 -
 169
169 -
 170
170 -
 171
171 -
 172
172 -
 173
173 -
 174
174 -
 175
175 -
 176
176 -
 177
177 -
 178
178 -
 179
179 -
 180
180 -
 181
181 -
 182
182 -
 183
183 -
184
-
185
-
186
-
187
-
188
-
189
-
190
-
191
-
192
-
193
-
194
-
195
-
196
-
197
-
198
-
199
-
200
-
201
-
202
-
203
-
204
-
205
-
206
-
207
-
208
-
209
-
210
-
211
-
212
-
213
-
214
-
215
-
216
-
217
-
218
-
219
-
220
-
221
-
222
-
223
-
224
-
225
-
226
-
227
 |
 |

Notes to the Consolidated Financial Statements (Continued)
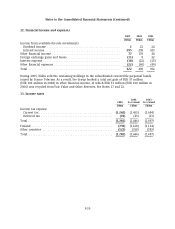
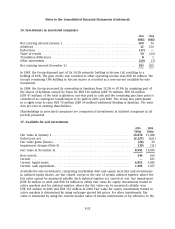
16. Investments in associated companies
2005 2004
EURm EURm
Net carrying amount January 1 ........................................... 200 76
Additions ............................................................ 12 150
Deductions ........................................................... (17) —
Share of results ....................................................... 10 (26)
Translation differences .................................................. 81
Other movements ...................................................... (20) (1)
Net carrying amount December 31 ........................................ 193 200
In 2005, the Group disposed part of its 36.2% minority holding in Aircom Ltd. resulting to a
holding of 10%. The gain on the sale recorded in other operating income was EUR 18 million. The
Group’s remaining 10% holding in Aircom shares is recorded as a non-current available-for-sale
investment.
In 2004, the Group increased its ownership in Symbian from 32.2% to 47.9% by acquiring part of
the shares of Symbian owned by Psion for EUR 102 million (GBP 70 million). EUR 68 million
(GBP 47 million) of the total acquisition cost was paid in cash and the remaining purchase price is
considered as contingent consideration to be paid in 2005 and 2006. The Group also participated
in a rights issue to raise EUR 73 million (GBP 50 million) additional funding to Symbian. The issue
was pro rata to existing shareholders.
Shareholdings in associated companies are comprised of investments in unlisted companies in all
periods presented.
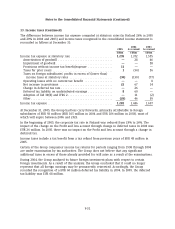
17. Available-for-sale investments
2005 2004
EURm EURm
Fair value at January 1 ............................................... 10,876 11,088
Deductions, net ..................................................... (2,227) (221)
Fair value gains (losses) .............................................. (28) 20
Impairment charges (Note 9) .......................................... (30) (11)
Fair value at December 31 ............................................ 8,591 10,876
Non-current ........................................................ 246 169
Current ........................................................... —255
Current, liquid assets ................................................ 6,852 9,085
Current, cash equivalents ............................................. 1,493 1,367
Available-for-sale investments, comprising marketable debt and equity securities and investments
in unlisted equity shares, are fair valued, except in the case of certain unlisted equities, where the
fair value cannot be measured reliably. Such unlisted equities are carried at cost, less impairment
(EUR 82 million in 2005 and EUR 54 million in 2004). Fair value for equity investments traded in
active markets and for unlisted equities, where the fair value can be measured reliably, was
EUR 165 million in 2005 and EUR 115 million in 2004. Fair value for equity investments traded in
active markets is determined by using exchange quoted bid prices. For other investments, fair
value is estimated by using the current market value of similar instruments or by reference to the
F-35