MoneyGram 2015 Annual Report Download - page 92
Download and view the complete annual report
Please find page 92 of the 2015 MoneyGram annual report below. You can navigate through the pages in the report by either clicking on the pages listed below, or by using the keyword search tool below to find specific information within the annual report.-
 1
1 -
2
-
3
-
4
-
5
-
6
-
7
-
8
-
9
-
10
-
11
-
12
-
13
-
14
-
15
-
16
-
17
-
18
-
19
-
20
-
21
-
22
-
23
-
24
-
25
-
26
-
27
-
28
-
29
-
30
-
31
-
32
-
33
-
34
-
35
-
36
-
37
-
38
-
39
-
40
-
41
-
42
-
43
-
44
-
45
-
46
-
47
-
48
-
49
-
50
-
51
-
52
-
53
-
54
-
55
-
56
-
57
-
58
-
59
-
60
-
61
-
62
-
63
-
64
-
65
-
66
-
67
-
68
-
69
-
70
-
71
-
72
-
73
-
74
-
75
-
76
-
77
-
78
-
79
-
80
-
81
-
 82
82 -
 83
83 -
 84
84 -
 85
85 -
 86
86 -
 87
87 -
 88
88 -
 89
89 -
 90
90 -
 91
91 -
 92
92 -
 93
93 -
 94
94 -
 95
95 -
 96
96 -
 97
97 -
 98
98 -
 99
99 -
 100
100 -
 101
101 -
 102
102 -
103
-
104
-
105
-
106
-
107
-
108
-
109
-
110
-
111
-
112
-
113
-
114
-
115
-
116
-
117
-
118
-
119
-
120
-
121
-
122
-
123
-
124
-
125
-
126
-
127
-
128
-
129
 |
 |

Table of Contents
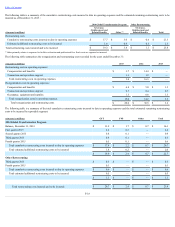
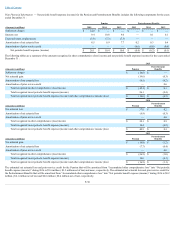
ActuarialValuationAssumptions — The measurement date for the Company’s Pension and Postretirement Benefits is December 31 . The following table is a
summary of the weighted-average actuarial assumptions used in calculating net periodic benefit expense (income) and the benefit obligation for the years ended
and as of December 31 :
Pension Plan
SERPs
Postretirement Benefits
2015
2014
2013
2015
2014
2013
2015
2014
2013
Net periodic benefit expense (income):
Discount rate 4.15%
4.81%
4.04%
4.78%
4.78%
3.99%
4.82%
4.82%
4.09%
Expected return on plan assets 4.74%
5.68%
6.20%
—
—
—
—
—
—
Rate of compensation increase —
—
—
5.75%
5.75%
5.75%
—
—
—
Initial healthcare cost trend rate —
—
—
—
—
—
6.50%
7.00%
8.00%
Ultimate healthcare cost trend rate —
—
—
—
—
—
4.50%
4.50%
5.00%
Year ultimate healthcare cost trend rate is reached —
—
—
—
—
—
2023
2023
2019
Benefit obligation:
Discount rate 4.31%
4.04%
4.81%
4.32%
4.04%
4.78%
4.53%
4.19%
4.82%
Rate of compensation increase —
—
—
5.75%
5.75%
5.75%
—
—
—
Initial healthcare cost trend rate —
—
—
—
—
—
6.50%
6.50%
7.00%
Ultimate healthcare cost trend rate —
—
—
—
—
—
4.50%
4.50%
4.50%
Year ultimate healthcare cost trend rate is reached —
—
—
—
—
—
2024
2023
2023
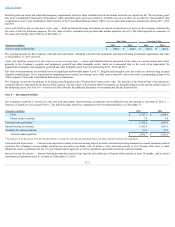
The Company utilizes a building-block approach in determining the long-term expected rate of return on plan assets. Historical markets are studied and long-term
historical relationships between equity securities and fixed income securities are preserved consistent with the widely accepted capital market principle that assets
with higher volatility generate a greater return over the long run. Current market factors, such as inflation and interest rates, are evaluated before long-term capital
market assumptions are determined. The long-term portfolio return also takes proper consideration of diversification and rebalancing. Peer data and historical
returns are reviewed for reasonableness and appropriateness.
Actuarial gains and losses are amortized using the corridor approach, by amortizing the balance exceeding 10% of the greater of the benefit obligation or the fair
value of plan assets. The amortization period is primarily based on the average remaining service life of plan participants for the Pension and the average remaining
expected life of plan participants for the Postretirement Benefits.
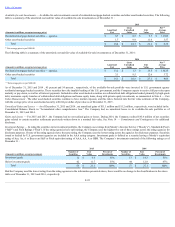
At December 31, 2015 , the Company changed its method for estimating the interest cost components of net periodic benefit expense for its Pension and
Postretirement Benefits. Previously, the Company estimated the interest cost components utilizing a single weighted-average discount rate derived from the yield
curve used to measure the benefit obligation. The new method utilizes a full yield curve approach in the estimation of these components by applying the specific
spot rates along the yield curve used in the determination of the benefit obligation to their underlying projected cash flows. This method provides a more precise
measurement of interest costs by improving the correlation between projected benefit cash flows and their corresponding spot rates. The change does not affect the
measurement of our total benefit obligations and it is accounted for as a change in accounting estimate, which is applied prospectively. For 2016, the change in
estimate is expected to reduce Pension and Postretirement Benefits net periodic benefit expense from $8.4 million to $6.6 million .
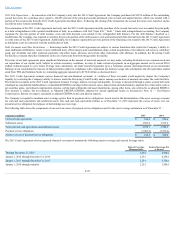
PensionAssets — The Company employs a total return investment approach whereby a mix of equity and fixed income securities are used to maximize the long-
term return of plan assets for a prudent level of risk. Risk tolerance is established through careful consideration of plan liabilities, plan funded status and corporate
financial condition. The investment portfolio contains a diversified blend of equity and fixed income securities. Furthermore, equity securities are diversified
across large and small capitalized securities, international securities and fixed income securities. Other assets, such as real estate and short-term investment funds,
are used on a limited basis. The Company strives to maintain an equity and fixed income securities allocation mix appropriate to its funded status. As of
December 31, 2015 , the funding mix was approximately 44 percent equity and 56 percent fixed income. Investment risk is measured and monitored on an ongoing
basis through quarterly investment portfolio reviews and annual liability measurements.
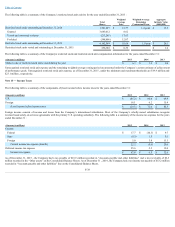
The following table is a summary of the Company’s weighted-average asset allocation for the Pension Plan by asset category at the measurement date as of
December 31 :
2015
2014
Equity securities 44%
44%
Fixed income securities 50%
51%
Real estate 5%
4%
Other 1%
1%
Total 100%
100%
F-28