MoneyGram 2015 Annual Report Download - page 110
Download and view the complete annual report
Please find page 110 of the 2015 MoneyGram annual report below. You can navigate through the pages in the report by either clicking on the pages listed below, or by using the keyword search tool below to find specific information within the annual report.-
 1
1 -
2
-
3
-
4
-
5
-
6
-
7
-
8
-
9
-
10
-
11
-
12
-
13
-
14
-
15
-
16
-
17
-
18
-
19
-
20
-
21
-
22
-
23
-
24
-
25
-
26
-
27
-
28
-
29
-
30
-
31
-
32
-
33
-
34
-
35
-
36
-
37
-
38
-
39
-
40
-
41
-
42
-
43
-
44
-
45
-
46
-
47
-
48
-
49
-
50
-
51
-
52
-
53
-
54
-
55
-
56
-
57
-
58
-
59
-
60
-
61
-
62
-
63
-
64
-
65
-
66
-
67
-
68
-
69
-
70
-
71
-
72
-
73
-
74
-
75
-
76
-
77
-
78
-
79
-
80
-
81
-
82
-
83
-
84
-
85
-
86
-
87
-
88
-
89
-
90
-
91
-
92
-
93
-
94
-
95
-
96
-
97
-
98
-
99
-
 100
100 -
 101
101 -
 102
102 -
 103
103 -
 104
104 -
 105
105 -
 106
106 -
 107
107 -
 108
108 -
 109
109 -
 110
110 -
 111
111 -
 112
112 -
 113
113 -
 114
114 -
 115
115 -
 116
116 -
 117
117 -
 118
118 -
 119
119 -
 120
120 -
121
-
122
-
123
-
124
-
125
-
126
-
127
-
128
-
129
 |
 |
Table of Contents
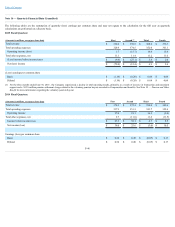
Note 16 — Quarterly Financial Data (Unaudited)
The following tables are the summation of quarterly (loss) earnings per common share and may not equate to the calculation for the full year as quarterly
calculations are performed on a discrete basis.
2015 Fiscal Quarters:
(Amounts in millions, except per share data) First
Second (1)
Third
Fourth
Total revenue $ 330.6
$ 358.8
$ 368.6
$ 376.7
Total operating expenses 328.9
374.5
352.0
363.1
Operating income (loss) 1.7
(15.7)
16.6
13.6
Total other expenses, net 11.1
11.4
11.2
11.6
(Loss) income before income taxes $ (9.4)
$ (27.1)
$ 5.4
$ 2.0
Net (loss) income $ (72.0)
$ (12.4)
$ 4.9
$ 2.6
(Loss) earnings per common share
Basic $ (1.16)
$ (0.20)
$ 0.08
$ 0.04
Diluted $ (1.16)
$ (0.20)
$ 0.08
$ 0.04
(1) For the three months ended June 30, 2015 , the Company experienced a decline in total operating results, primarily as a result of increase in Transaction and operations
support and a $13.8 million pension settlement charge related to the voluntary pension buyout recorded in Compensation and benefits. See Note 10 — PensionandOther
Benefitfor more information regarding the voluntary pension buyout.
2014 Fiscal Quarters:
(Amounts in millions, except per share data) First
Second
Third
Fourth
Total revenue $ 374.9
$ 372.4
$ 358.0
$ 349.6
Total operating expenses 337.9
351.3
341.7
352.6
Operating income 37.0
21.1
16.3
(3.0)
Total other expenses, net 9.7
(11.0)
11.6
(11.5)
Income before income taxes $ 27.3
$ 32.1
$ 4.7
$ 8.5
Net income (loss) $ 39.0
$ 25.6
$ (3.0)
$ 10.5
Earnings (loss) per common share
Basic $ 0.54
$ 0.40
$ (0.05)
$ 0.17
Diluted $ 0.54
$ 0.40
$ (0.05)
$ 0.17
F-46