MoneyGram 2015 Annual Report Download - page 48
Download and view the complete annual report
Please find page 48 of the 2015 MoneyGram annual report below. You can navigate through the pages in the report by either clicking on the pages listed below, or by using the keyword search tool below to find specific information within the annual report.-
 1
1 -
2
-
3
-
4
-
5
-
6
-
7
-
8
-
9
-
10
-
11
-
12
-
13
-
14
-
15
-
16
-
17
-
18
-
19
-
20
-
21
-
22
-
23
-
24
-
25
-
26
-
27
-
28
-
29
-
30
-
31
-
32
-
33
-
34
-
35
-
36
-
37
-
 38
38 -
 39
39 -
 40
40 -
 41
41 -
 42
42 -
 43
43 -
 44
44 -
 45
45 -
 46
46 -
 47
47 -
 48
48 -
 49
49 -
 50
50 -
 51
51 -
 52
52 -
 53
53 -
 54
54 -
 55
55 -
 56
56 -
 57
57 -
 58
58 -
59
-
60
-
61
-
62
-
63
-
64
-
65
-
66
-
67
-
68
-
69
-
70
-
71
-
72
-
73
-
74
-
75
-
76
-
77
-
78
-
79
-
80
-
81
-
82
-
83
-
84
-
85
-
86
-
87
-
88
-
89
-
90
-
91
-
92
-
93
-
94
-
95
-
96
-
97
-
98
-
99
-
100
-
101
-
102
-
103
-
104
-
105
-
106
-
107
-
108
-
109
-
110
-
111
-
112
-
113
-
114
-
115
-
116
-
117
-
118
-
119
-
120
-
121
-
122
-
123
-
124
-
125
-
126
-
127
-
128
-
129
 |
 |

Table of Contents
assumptions, including assumptions about future cash flows, growth rates and discount rates. The assumptions about future cash flows and growth rates are based
on our long-term projections by reporting unit. In addition, an assumed terminal value is used to project future cash flows beyond base years. Assumptions used in
our impairment testing are consistent with our internal forecasts and operating plans. Our discount rate is based on our debt and equity balances, adjusted for
current market conditions and investor expectations of return on our equity. If the fair value of a reporting unit exceeds its carrying amount, there is no impairment.
If not, the second step of the goodwill impairment test compares the implied fair value of the reporting unit’s goodwill with its carrying amount. To the extent the
carrying amount of the reporting unit’s goodwill exceeds its implied fair value, a write-down of the reporting unit’s goodwill would be necessary.
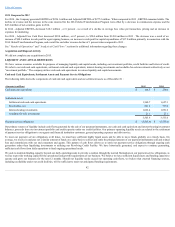
We did not recognize a goodwill impairment loss for 2015 , 2014 or 2013 . The carrying value of goodwill assigned to the Global Funds Transfer reporting unit at
December 31, 2015 was $442.2 million . The annual impairment test indicated a fair value for the Global Funds Transfer reporting unit that was substantially in
excess of the reporting unit’s carrying value. In order to evaluate the sensitivity of the fair value calculations, we applied a hypothetical 10 percent decrease to the
fair value of the Global Funds Transfer reporting unit. Had the estimated fair value been hypothetically lower by 10 percent as of December 31, 2015 , the fair
value of goodwill would still be substantially in excess of the reporting unit’s carrying value.
Fair Value of Investment Securities — The Company has available-for-sale investments that are recorded at their estimated fair value. Our available-for-sale
investments consist of residential mortgage-backed securities and other asset-backed securities.
We estimate fair value for our investments at an “exit price,” or the exchange price that would be received for an asset in an orderly transaction between market
participants. Observable price quotes for our exact securities are not available. For our government agency residential mortgage-backed securities, similar
securities trade with sufficient regularity to allow observation of market inputs needed to estimate fair value. For our other asset-backed securities, the overall
liquidity and trading within the relevant markets is not strong. Accordingly, observable market inputs are not as readily available and estimating fair value is more
subjective. See Note 4 — FairValueMeasurementof the Notes to the Consolidated Financial Statements for additional disclosure.
Pension— Through the Company's Pension Plan and SERPs, collectively referred to as our “Pension," we provide defined benefit pension plan coverage to certain
of our employees and certain employees of Viad Corporation, our former parent. Our pension obligations under these plans are measured as of December 31, the
measurement date. Pension benefit obligations and the related expense are based upon actuarial projections using assumptions regarding mortality, discount rates,
long-term return on assets and other factors.
Our assumptions reflect our historical experience and management’s best judgment regarding future expectations. Certain of the assumptions, particularly the
discount rate and expected return on plan assets, require significant judgment and could have a material impact on the measurement of our pension obligation.
At December 31, 2015 , the Company changed its method of estimating the interest cost components of net periodic benefit expense for its Pension and
Postretirement Benefits. Previously, the Company estimated the interest cost components utilizing a single weighted-average discount rate derived from the yield
curve used to measure the benefit obligation. The new method utilizes a full yield curve approach in the estimation of these components by applying the specific
spot rates along the yield curve used in the determination of the benefit obligation to their underlying projected cash flows. This method provides a more precise
measurement of interest costs by improving the correlation between projected benefit cash flows and their corresponding spot rates. The change does not affect the
measurement of our total benefit obligations and is accounted for as a change in accounting estimate, which is applied prospectively. For 2016, the change in
estimate is expected to reduce Pension and Postretirement Benefits net periodic benefit expense from $8.4 million to $6.6 million .
At each measurement date, the discount rate used to measure total benefit obligation for the Pension and Postretirement Benefits is based on the then current
interest rate yield curves for long-term corporate debt securities with maturities rated AA comparable to our obligations.
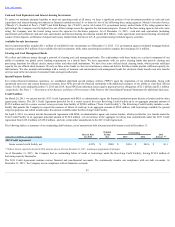
Our Pension Plan assets are primarily invested in short-term investment fund accounts and commingled trust funds issued or sponsored by the plan trustee. Our
investments are periodically realigned in accordance with the investment guidelines. The expected return on Pension Plan assets is based on our historical market
experience, our asset allocations and our expectations for long-term rates of return. We also consider peer data and historical returns to assess the reasonableness
and appropriateness of our assumption. Our Pension Plan asset allocations are reviewed annually and are based upon plan obligations, an evaluation of market
conditions, tolerance for risk and cash requirements for benefit payments.
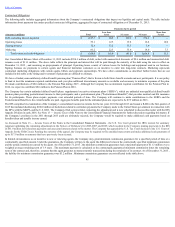
Lower discount rates increase the Pension and Postretirement Benefits obligation and subsequent year pension expense, while higher discount rates decrease the
Pension and Postretirement Benefits obligation and subsequent year pension expense. Decreasing the discount rate by 50 basis points would have increased the
2015 Pension and Postretirement Benefits net periodic benefit expense by $0.7 million . If the discount rate increased by 50 basis points, the Pension and
Postretirement Benefits net periodic benefit expense would have decreased by $0.6 million . Decreasing the expected rate of return by 50 basis points would have
decreased the 2015 Pension Plan net periodic benefit expense by $0.7 million .
47