MoneyGram 2015 Annual Report Download - page 88
Download and view the complete annual report
Please find page 88 of the 2015 MoneyGram annual report below. You can navigate through the pages in the report by either clicking on the pages listed below, or by using the keyword search tool below to find specific information within the annual report.-
 1
1 -
2
-
3
-
4
-
5
-
6
-
7
-
8
-
9
-
10
-
11
-
12
-
13
-
14
-
15
-
16
-
17
-
18
-
19
-
20
-
21
-
22
-
23
-
24
-
25
-
26
-
27
-
28
-
29
-
30
-
31
-
32
-
33
-
34
-
35
-
36
-
37
-
38
-
39
-
40
-
41
-
42
-
43
-
44
-
45
-
46
-
47
-
48
-
49
-
50
-
51
-
52
-
53
-
54
-
55
-
56
-
57
-
58
-
59
-
60
-
61
-
62
-
63
-
64
-
65
-
66
-
67
-
68
-
69
-
70
-
71
-
72
-
73
-
74
-
75
-
76
-
77
-
 78
78 -
 79
79 -
 80
80 -
 81
81 -
 82
82 -
 83
83 -
 84
84 -
 85
85 -
 86
86 -
 87
87 -
 88
88 -
 89
89 -
 90
90 -
 91
91 -
 92
92 -
 93
93 -
 94
94 -
 95
95 -
 96
96 -
 97
97 -
 98
98 -
99
-
100
-
101
-
102
-
103
-
104
-
105
-
106
-
107
-
108
-
109
-
110
-
111
-
112
-
113
-
114
-
115
-
116
-
117
-
118
-
119
-
120
-
121
-
122
-
123
-
124
-
125
-
126
-
127
-
128
-
129
 |
 |
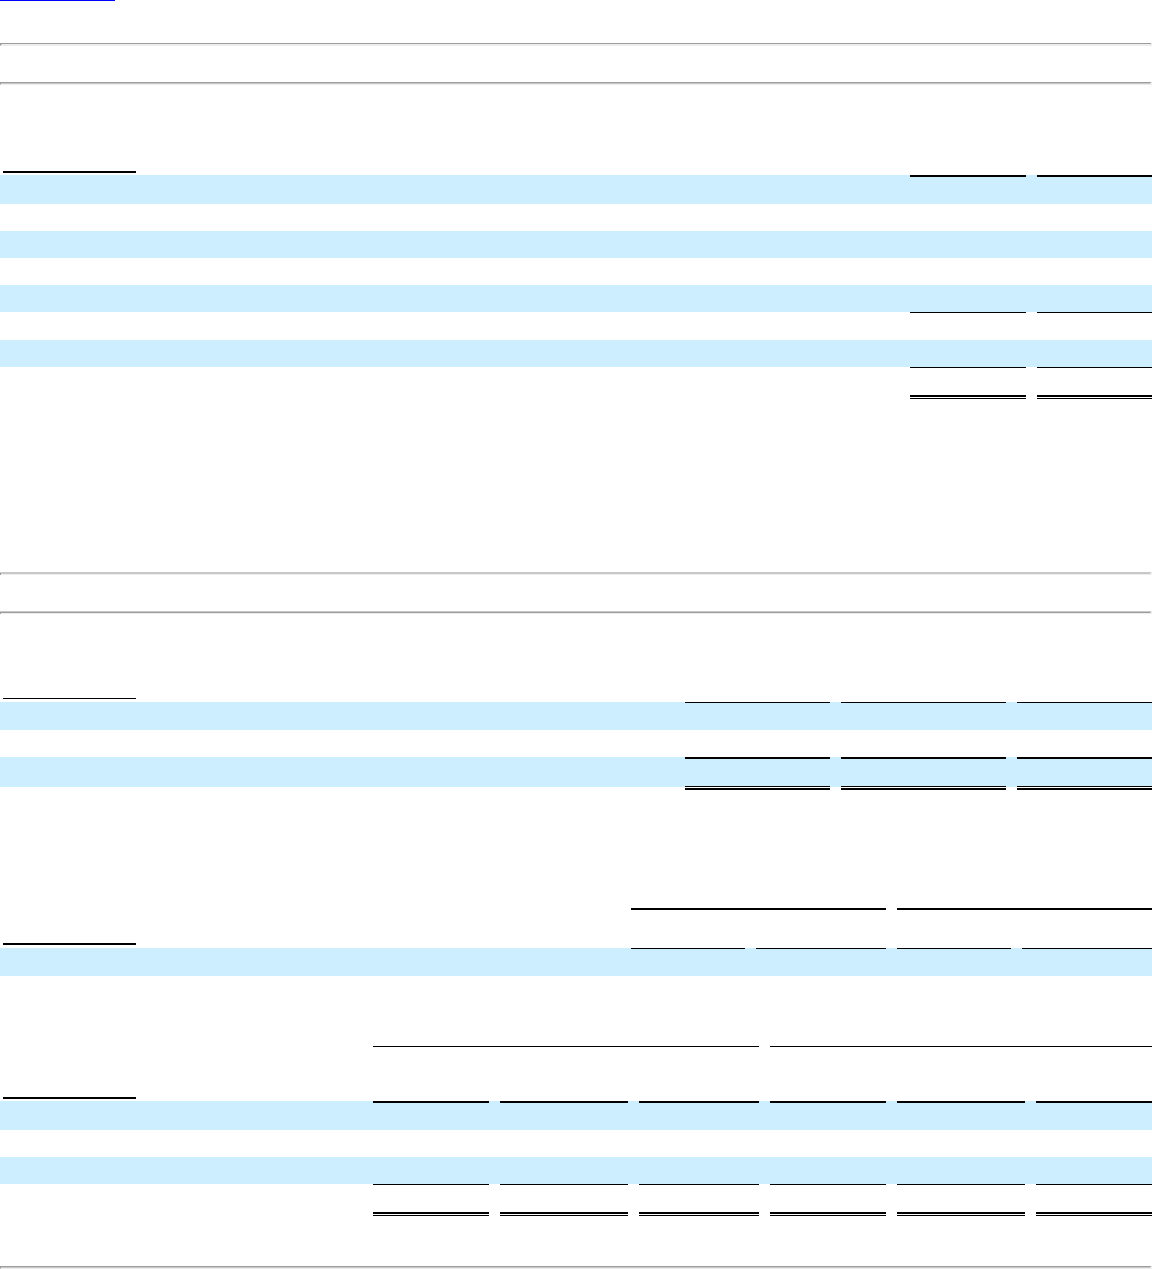
Table of Contents
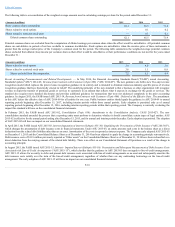
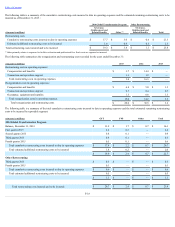
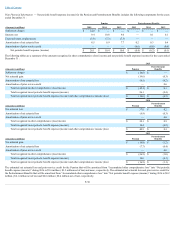
Note 7 — Property and Equipment
The following table is a summary of "Property and equipment, net" as of December 31 :
(Amounts in millions) 2015
2014
Computer hardware and software $ 338.0
$ 268.8
Signage 87.9
86.9
Equipment at agent locations 58.0
80.1
Office furniture and equipment 29.2
34.8
Leasehold improvements 24.7
35.1
Total property and equipment 537.8
505.7
Accumulated depreciation and amortization (338.1)
(340.1)
Total property and equipment, net $ 199.7
$ 165.6
Depreciation and amortization expense for property and equipment for 2015 , 2014 and 2013 was $63.4 million , $53.4 million , and $50.0 million , respectively.
At December 31, 2015 and 2014 , there was $7.5 million and $17.0 million , respectively, of property and equipment that had been received by the Company and
included in “Accounts payable and other liabilities” in the Consolidated Balance Sheets.
During 2015 , the Company had a nominal loss related to relocations or disposal of its property and equipment. During 2014 and 2013 , the Company recognized a
loss of $0.2 million and $0.1 million , respectively, on furniture and equipment related to office relocations and disposal of equipment and signage at agent
locations. The losses were recorded in the “Occupancy, equipment and supplies” line in the Consolidated Statements of Operations.
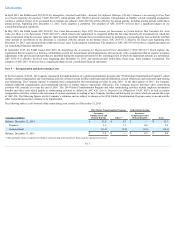
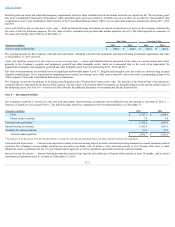
Note 8 — Goodwill and Intangible Assets
The following table is a roll-forward of goodwill by reporting segment:
(Amounts in millions)
Global Funds
Transfer
Financial Paper
Products
Total
Balance as of December 31, 2014 $ 442.5
$ —
$ 442.5
Currency translation (0.3)
—
(0.3)
Balance as of December 31, 2015 $ 442.2
$ —
$ 442.2
The Company performed an annual assessment of goodwill during the fourth quarter of 2015 , 2014 and 2013 . No impairments of goodwill were recorded in 2015
, 2014 and 2013 .
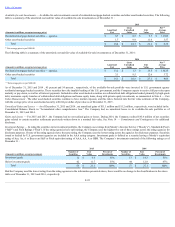
The following table is a summary of the gross goodwill balances and accumulated impairments as of December 31 :
2015
2014
(Amounts in millions) Gross Goodwill
Accumulated
Impairments
Gross Goodwill
Accumulated
Impairments
Global Funds Transfer $ 445.4
$ (3.2)
$ 445.7
$ (3.2)
The following table is a summary of intangible assets included in “Other assets” in the Consolidated Balance Sheets as of December 31 :
2015
2014
(Amounts in millions)
Gross
Carrying
Value
Accumulated
Amortization
Net
Carrying
Value
Gross
Carrying
Value
Accumulated
Amortization
Net
Carrying
Value
Contractual and customer relationships $ 11.7
$ (4.5)
$ 7.2
$ 12.3
$ (2.6)
$ 9.7
Non-compete agreements 1.6
(0.7)
0.9
1.6
(0.4)
1.2
Developed technology 1.1
(0.2)
0.9
1.1
(0.1)
1.0
Total intangible assets $ 14.4
$ (5.4)
$ 9.0
$ 15.0
$ (3.1)
$ 11.9
F-24