MoneyGram 2015 Annual Report Download - page 47
Download and view the complete annual report
Please find page 47 of the 2015 MoneyGram annual report below. You can navigate through the pages in the report by either clicking on the pages listed below, or by using the keyword search tool below to find specific information within the annual report.-
 1
1 -
2
-
3
-
4
-
5
-
6
-
7
-
8
-
9
-
10
-
11
-
12
-
13
-
14
-
15
-
16
-
17
-
18
-
19
-
20
-
21
-
22
-
23
-
24
-
25
-
26
-
27
-
28
-
29
-
30
-
31
-
32
-
33
-
34
-
35
-
36
-
 37
37 -
 38
38 -
 39
39 -
 40
40 -
 41
41 -
 42
42 -
 43
43 -
 44
44 -
 45
45 -
 46
46 -
 47
47 -
 48
48 -
 49
49 -
 50
50 -
 51
51 -
 52
52 -
 53
53 -
 54
54 -
 55
55 -
 56
56 -
 57
57 -
58
-
59
-
60
-
61
-
62
-
63
-
64
-
65
-
66
-
67
-
68
-
69
-
70
-
71
-
72
-
73
-
74
-
75
-
76
-
77
-
78
-
79
-
80
-
81
-
82
-
83
-
84
-
85
-
86
-
87
-
88
-
89
-
90
-
91
-
92
-
93
-
94
-
95
-
96
-
97
-
98
-
99
-
100
-
101
-
102
-
103
-
104
-
105
-
106
-
107
-
108
-
109
-
110
-
111
-
112
-
113
-
114
-
115
-
116
-
117
-
118
-
119
-
120
-
121
-
122
-
123
-
124
-
125
-
126
-
127
-
128
-
129
 |
 |
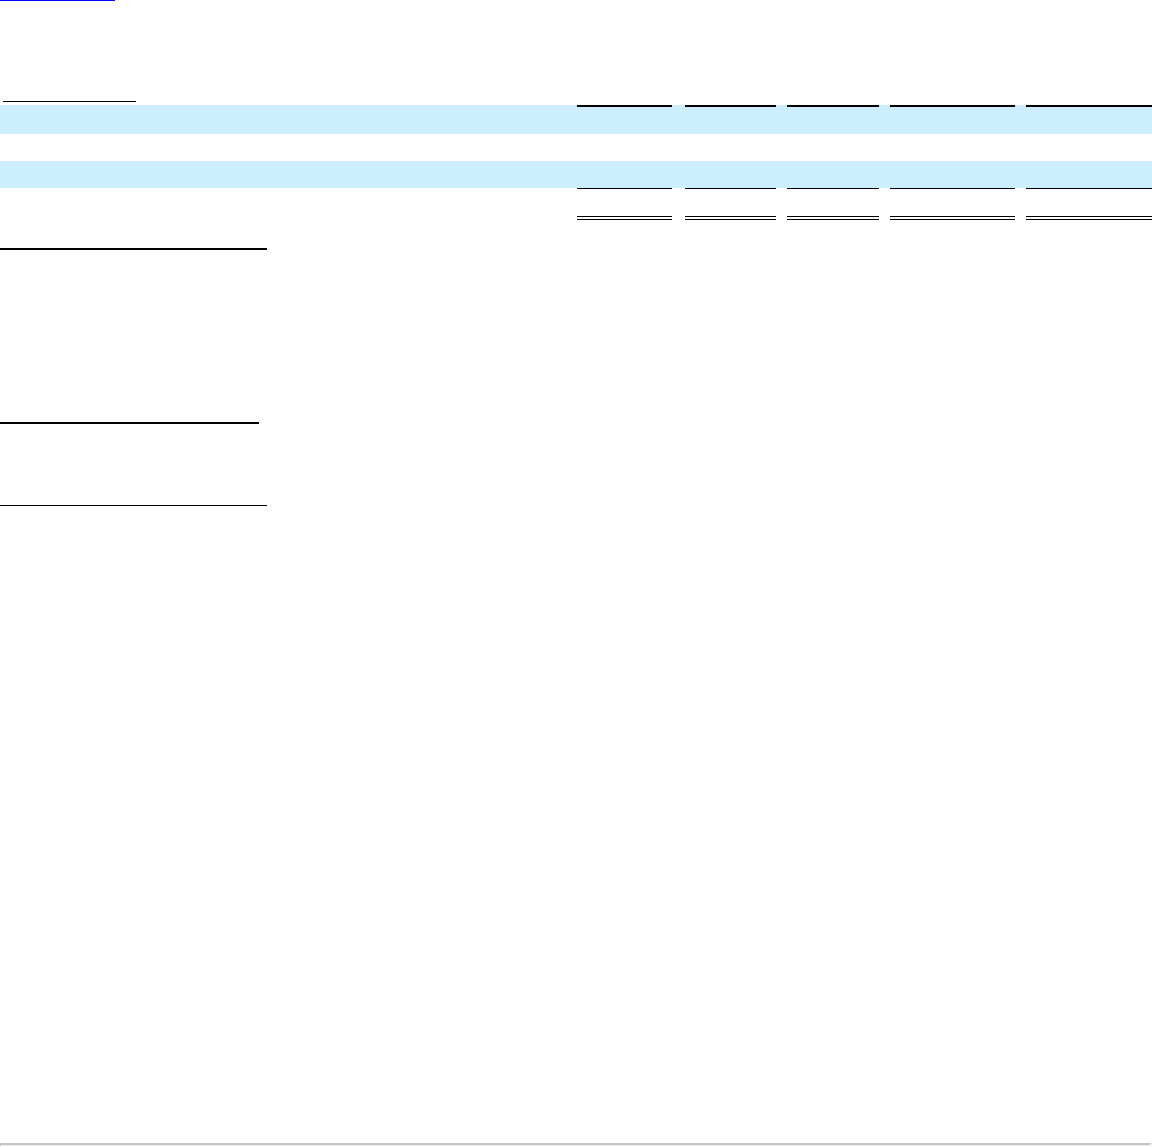
Table of Contents
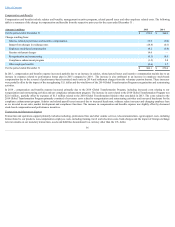
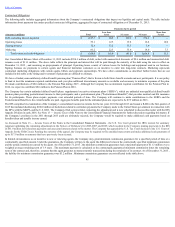
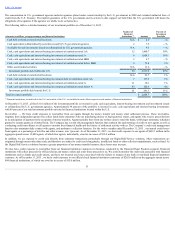
Analysis of Cash Flows
(Amounts in millions) 2015
2014
2013
2015 vs 2014
2014 vs 2013
Net cash provided by operating activities $ 33.6
$ 62.3
$ 156.1
$ (28.7)
$ (93.8)
Net cash used in investing activities (109.5)
(96.4)
(63.5)
(13.1)
(32.9)
Net cash used in financing activities (10.2)
(34.1)
(1.7)
23.9
(32.4)
Net change in cash and cash equivalents $ (86.1)
$ (68.2)
$ 90.9
$ (17.9)
$ (159.1)
CashFlowsfromOperatingActivities
During 2015 , cash provided by operating activities decreased by $28.7 million from $62.3 million in 2014 primarily due to the decrease in net income of $149.0
million and a decrease in accounts payable and other liabilities mainly due to net cash tax payments of $64.4 million in 2015 . The decrease in cash provided by
operating activities was primarily offset by the change in other assets due to the 2015 foreign currency settlements related to our forward contracts, the impact of
the change in deferred taxes and the 2015 liquidation of the rabbi trusts associated with the deferred compensation plan.
Cash provided by operating activities decreased for the year ended December 31, 2014 due to an increase in signing bonus payments. Cash provided by operating
activities increased for the year ended December 31, 2013 due to an increase in consolidated operating income.
CashFlowsfromInvestingActivities
Items impacting cash used in investing activities in 2015 , 2014 and 2013 were primarily from capital expenditures of $109.9 million , $85.8 million and $48.8
million , respectively. Additionally, during 2014 and 2013 cash paid for acquisitions was $11.5 million and $15.4 million , respectively.
CashFlowsfromFinancingActivities
In 2015 , items impacting net cash used in financing activities were $9.8 million principal payments on debt and $0.4 million of stock repurchases. In 2014 ,
financing activities used $34.1 million of cash, primarily associated with stock repurchases. The proceeds from the debt issuance pursuant to the 2013 Credit
Agreement were used to fund most of this stock repurchase. In 2013 , financing activities used $1.7 million of cash primarily associated with the 2013 Credit
Agreement.
Stockholders’ Deficit
Stockholders’Deficit — The Company is authorized to repurchase up to 12,000,000 shares of our common stock. As of December 31, 2015 , we had repurchased
a total of 8,277,073 shares of our common stock under this authorization and have remaining authorization to purchase up to 3,722,927 shares.
Under the terms of our outstanding credit facilities, we are limited in our ability to pay dividends on our common stock. No dividends were paid on our common
stock in 2015 , and we do not anticipate declaring any dividends on our common stock during 2016 .
Off-Balance Sheet Arrangements
None.
Critical Accounting Policies and Estimates
The preparation of financial statements in conformity with GAAP requires estimates and assumptions that affect the reported amounts and related disclosures in the
consolidated financial statements. Actual results could differ from those estimates. On a regular basis, management reviews its accounting policies, assumptions
and estimates to ensure that our financial statements are presented fairly and in accordance with GAAP. Our significant accounting policies are discussed in
Note 2 — SummaryofSignificantAccountingPoliciesof the Notes to the Consolidated Financial Statements.
Critical accounting policies are those policies that management believes are very important to the portrayal of our financial position and results of operations, and
that require management to make estimates that are difficult, subjective or complex. Based on these criteria, management has identified and discussed with the
Audit Committee the following critical accounting policies and estimates, including the methodology and disclosures related to those estimates.
Goodwill— We have two reporting units: Global Funds Transfer and Financial Paper Products. Our Global Funds Transfer reporting unit is the only reporting unit
that carries goodwill. On an annual basis, or more frequently upon the occurrence of certain events, we test for goodwill impairment using a two-step process. The
first step is to identify a potential impairment by comparing the fair value of a reporting unit with its carrying amount. The fair value of a reporting unit is
determined based on a discounted cash flow analysis and further analyzed using other methods of valuation. A discounted cash flow analysis requires us to make
various
46