MoneyGram 2015 Annual Report Download - page 102
Download and view the complete annual report
Please find page 102 of the 2015 MoneyGram annual report below. You can navigate through the pages in the report by either clicking on the pages listed below, or by using the keyword search tool below to find specific information within the annual report.-
 1
1 -
2
-
3
-
4
-
5
-
6
-
7
-
8
-
9
-
10
-
11
-
12
-
13
-
14
-
15
-
16
-
17
-
18
-
19
-
20
-
21
-
22
-
23
-
24
-
25
-
26
-
27
-
28
-
29
-
30
-
31
-
32
-
33
-
34
-
35
-
36
-
37
-
38
-
39
-
40
-
41
-
42
-
43
-
44
-
45
-
46
-
47
-
48
-
49
-
50
-
51
-
52
-
53
-
54
-
55
-
56
-
57
-
58
-
59
-
60
-
61
-
62
-
63
-
64
-
65
-
66
-
67
-
68
-
69
-
70
-
71
-
72
-
73
-
74
-
75
-
76
-
77
-
78
-
79
-
80
-
81
-
82
-
83
-
84
-
85
-
86
-
87
-
88
-
89
-
90
-
91
-
 92
92 -
 93
93 -
 94
94 -
 95
95 -
 96
96 -
 97
97 -
 98
98 -
 99
99 -
 100
100 -
 101
101 -
 102
102 -
 103
103 -
 104
104 -
 105
105 -
 106
106 -
 107
107 -
 108
108 -
 109
109 -
 110
110 -
 111
111 -
 112
112 -
113
-
114
-
115
-
116
-
117
-
118
-
119
-
120
-
121
-
122
-
123
-
124
-
125
-
126
-
127
-
128
-
129
 |
 |

Table of Contents
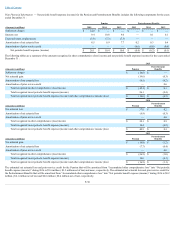
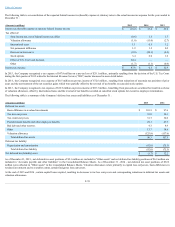
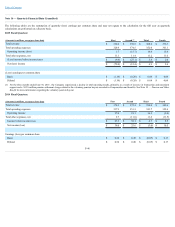
The following table is a summary of the Company’s restricted stock unit activity for the year ended December 31, 2015 :
Total
Shares
Weighted
Average
Price
Weighted-Average
Remaining
Contractual Term
Aggregate
Intrinsic Value
($000,000)
Restricted stock units outstanding at December 31, 2014 1,701,607
$ 15.77
1.4 years
$ 15.5
Granted 3,043,012
8.62
Vested and converted to shares (233,245)
17.63
Forfeited (348,806)
12.07
Restricted stock units outstanding at December 31, 2015 4,162,568
$ 10.68
1.0 year
$ 26.1
Restricted stock units vested and outstanding at December 31, 2015 256,388
$ 8.39
$ 1.6
The following table is a summary of the Company's restricted stock and restricted stock unit compensation information for the years ended December 31 :
(Amounts in millions) 2015
2014
2013
Market value of restricted stock units vested during the year $ 6.3
$ 1.5
$ 0.8
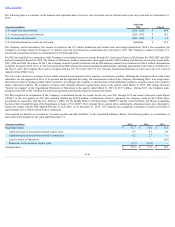
Unrecognized restricted stock unit expense and the remaining weighted-average vesting period are presented under the Company’s current estimate of achievement
of performance goals. Unrecognized restricted stock unit expense, as of December 31, 2015 , under the minimum and maximum thresholds are $19.9 million and
$23.1 million , respectively.
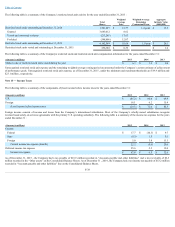
Note 13 — Income Taxes
The following table is a summary of the components of (loss) income before income taxes for the years ended December 31 :
(Amounts in millions) 2015
2014
2013
U.S. $ (45.2)
$ 66.4
$ 69.9
Foreign 16.1
6.2
15.4
(Loss) income before income taxes $ (29.1)
$ 72.6
$ 85.3
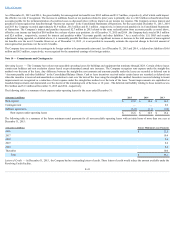
Foreign income consists of income and losses from the Company’s international subsidiaries. Most of the Company’s wholly-owned subsidiaries recognize
revenue based solely on services agreements with the primary U.S. operating subsidiary. The following table is a summary of the income tax expense for the years
ended December 31 :
(Amounts in millions) 2015
2014
2013
Current:
Federal $ 17.7
$ (10.3)
$ 9.7
State (0.5)
1.5
0.1
Foreign 5.0
3.8
11.1
Current income tax expense (benefit) 22.2
(5.0)
20.9
Deferred income tax expense 25.6
5.5
12.0
Income tax expense $ 47.8
$ 0.5
$ 32.9
As of December 31, 2015 , the Company had a tax payable of $16.9 million recorded in “Accounts payable and other liabilities” and a tax receivable of $6.3
million recorded in the “Other assets” on the Consolidated Balance Sheets. As of December 31 , 2014 , the Company had a net income tax payable of $53.2 million
recorded in “Accounts payable and other liabilities” line on the Consolidated Balance Sheets.
F-38