MoneyGram 2015 Annual Report Download - page 28
Download and view the complete annual report
Please find page 28 of the 2015 MoneyGram annual report below. You can navigate through the pages in the report by either clicking on the pages listed below, or by using the keyword search tool below to find specific information within the annual report.-
 1
1 -
2
-
3
-
4
-
5
-
6
-
7
-
8
-
9
-
10
-
11
-
12
-
13
-
14
-
15
-
16
-
17
-
 18
18 -
 19
19 -
 20
20 -
 21
21 -
 22
22 -
 23
23 -
 24
24 -
 25
25 -
 26
26 -
 27
27 -
 28
28 -
 29
29 -
 30
30 -
 31
31 -
 32
32 -
 33
33 -
 34
34 -
 35
35 -
 36
36 -
 37
37 -
 38
38 -
39
-
40
-
41
-
42
-
43
-
44
-
45
-
46
-
47
-
48
-
49
-
50
-
51
-
52
-
53
-
54
-
55
-
56
-
57
-
58
-
59
-
60
-
61
-
62
-
63
-
64
-
65
-
66
-
67
-
68
-
69
-
70
-
71
-
72
-
73
-
74
-
75
-
76
-
77
-
78
-
79
-
80
-
81
-
82
-
83
-
84
-
85
-
86
-
87
-
88
-
89
-
90
-
91
-
92
-
93
-
94
-
95
-
96
-
97
-
98
-
99
-
100
-
101
-
102
-
103
-
104
-
105
-
106
-
107
-
108
-
109
-
110
-
111
-
112
-
113
-
114
-
115
-
116
-
117
-
118
-
119
-
120
-
121
-
122
-
123
-
124
-
125
-
126
-
127
-
128
-
129
 |
 |
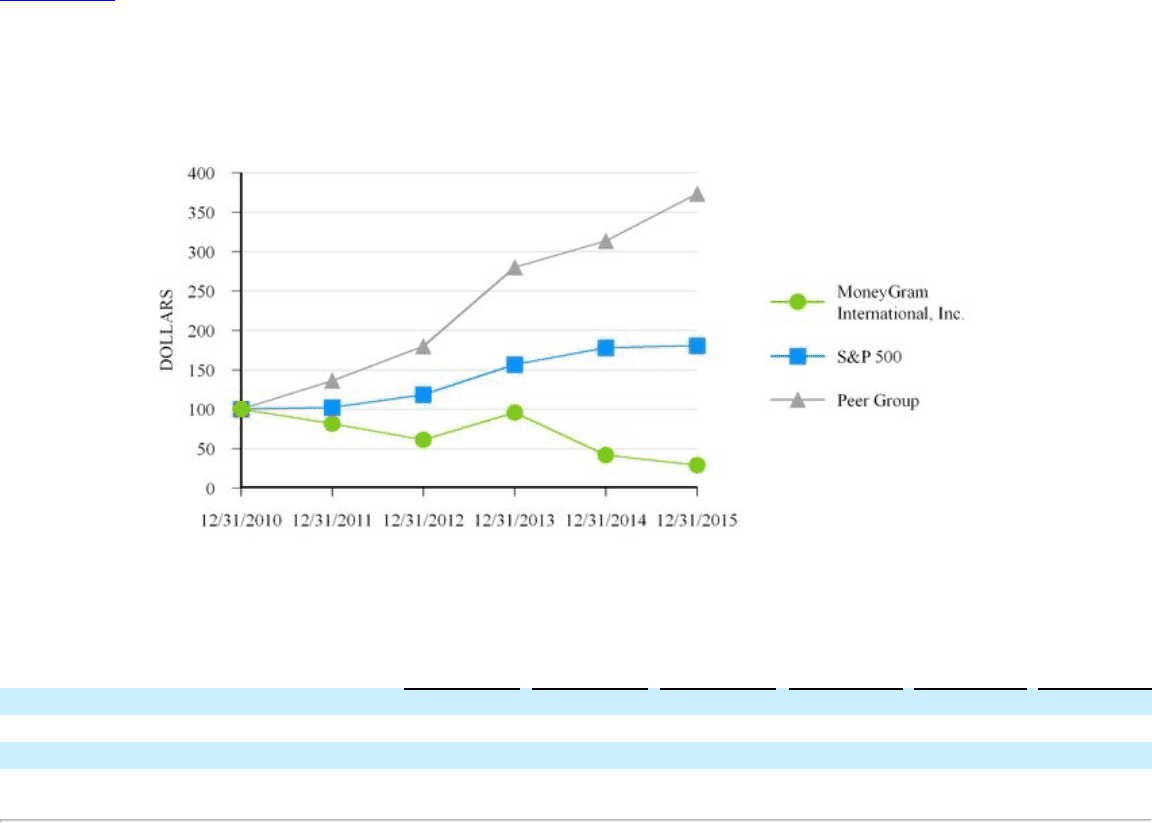
Table of Contents
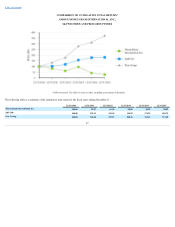
COMPARISON OF CUMULATIVE TOTAL RETURN*
AMONG MONEYGRAM INTERNATIONAL, INC.,
S&P 500 INDEX AND PEER GROUP INDEX
*$100 invested on 12/31/2010 in stock or index, including reinvestment of dividends.
The following table is a summary of the cumulative total return for the fiscal years ending December 31 :
12/31/2010
12/31/2011
12/31/2012
12/31/2013
12/31/2014
12/31/2015
MoneyGram International, Inc. 100.00
81.87
61.30
95.85
41.93
28.92
S&P 500 100.00
102.11
118.45
156.82
178.29
180.75
Peer Group 100.00
136.28
179.87
280.16
313.43
373.60
27