MoneyGram 2015 Annual Report Download - page 72
Download and view the complete annual report
Please find page 72 of the 2015 MoneyGram annual report below. You can navigate through the pages in the report by either clicking on the pages listed below, or by using the keyword search tool below to find specific information within the annual report.-
 1
1 -
2
-
3
-
4
-
5
-
6
-
7
-
8
-
9
-
10
-
11
-
12
-
13
-
14
-
15
-
16
-
17
-
18
-
19
-
20
-
21
-
22
-
23
-
24
-
25
-
26
-
27
-
28
-
29
-
30
-
31
-
32
-
33
-
34
-
35
-
36
-
37
-
38
-
39
-
40
-
41
-
42
-
43
-
44
-
45
-
46
-
47
-
48
-
49
-
50
-
51
-
52
-
53
-
54
-
55
-
56
-
57
-
58
-
59
-
60
-
61
-
 62
62 -
 63
63 -
 64
64 -
 65
65 -
 66
66 -
 67
67 -
 68
68 -
 69
69 -
 70
70 -
 71
71 -
 72
72 -
 73
73 -
 74
74 -
 75
75 -
 76
76 -
 77
77 -
 78
78 -
 79
79 -
 80
80 -
 81
81 -
 82
82 -
83
-
84
-
85
-
86
-
87
-
88
-
89
-
90
-
91
-
92
-
93
-
94
-
95
-
96
-
97
-
98
-
99
-
100
-
101
-
102
-
103
-
104
-
105
-
106
-
107
-
108
-
109
-
110
-
111
-
112
-
113
-
114
-
115
-
116
-
117
-
118
-
119
-
120
-
121
-
122
-
123
-
124
-
125
-
126
-
127
-
128
-
129
 |
 |

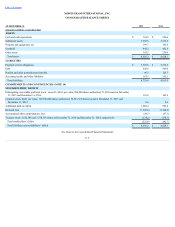
Table of Contents
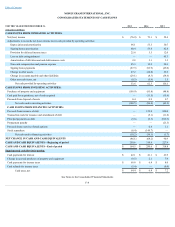
MONEYGRAM INTERNATIONAL, INC.
CONSOLIDATED STATEMENTS OF CASH FLOWS
FOR THE YEAR ENDED DECEMBER 31, 2015
2014
2013
(Amounts in millions)
CASH FLOWS FROM OPERATING ACTIVITIES:
Net (loss) income $ (76.9)
$ 72.1
$ 52.4
Adjustments to reconcile net (loss) income to net cash provided by operating activities:
Depreciation and amortization 66.1
55.5
50.7
Signing bonus amortization 60.4
53.8
42.8
Provision for deferred income taxes 25.6
5.5
12.0
Loss on debt extinguishment —
—
45.3
Amortization of debt discount and debt issuance costs 2.8
3.1
3.3
Non-cash compensation and pension expense 45.3
15.2
20.3
Signing bonus payments (87.3)
(93.9)
(45.0)
Change in other assets 27.2
(34.8)
29.2
Change in accounts payable and other liabilities (29.1)
(8.3)
(58.4)
Other non-cash items, net (0.5)
(5.9)
3.5
Net cash provided by operating activities 33.6
62.3
156.1
CASH FLOWS FROM INVESTING ACTIVITIES:
Purchases of property and equipment (109.9)
(85.8)
(48.8)
Cash paid for acquisitions, net of cash acquired —
(11.5)
(15.4)
Proceeds from disposal of assets 0.4
0.9
0.7
Net cash used in investing activities (109.5)
(96.4)
(63.5)
CASH FLOWS FROM FINANCING ACTIVITIES:
Proceeds from issuance of debt —
129.8
850.0
Transaction costs for issuance and amendment of debt —
(5.1)
(11.8)
Principal payments on debt (9.8)
(9.5)
(819.5)
Prepayment penalty —
—
(21.5)
Proceeds from exercise of stock options —
0.4
1.1
Stock repurchase (0.4)
(149.7)
—
Net cash used in financing activities (10.2)
(34.1)
(1.7)
NET CHANGE IN CASH AND CASH EQUIVALENTS (86.1)
(68.2)
90.9
CASH AND CASH EQUIVALENTS—Beginning of period 250.6
318.8
227.9
CASH AND CASH EQUIVALENTS—End of period $ 164.5
$ 250.6
$ 318.8
Supplemental cash flow information:
Cash payments for interest $ 42.1
$ 41.1
$ 43.9
Change in accrued purchases of property and equipment (9.5)
2.1
7.9
Cash payments for income taxes $ 69.8
$ 6.4
$ 8.0
Cash refunds for income taxes (5.4)
—
(0.8)
Cash taxes, net $ 64.4
$ 6.4
$ 7.2
See Notes to the Consolidated Financial Statements
F-8