MoneyGram 2015 Annual Report Download - page 35
Download and view the complete annual report
Please find page 35 of the 2015 MoneyGram annual report below. You can navigate through the pages in the report by either clicking on the pages listed below, or by using the keyword search tool below to find specific information within the annual report.-
 1
1 -
2
-
3
-
4
-
5
-
6
-
7
-
8
-
9
-
10
-
11
-
12
-
13
-
14
-
15
-
16
-
17
-
18
-
19
-
20
-
21
-
22
-
23
-
24
-
 25
25 -
 26
26 -
 27
27 -
 28
28 -
 29
29 -
 30
30 -
 31
31 -
 32
32 -
 33
33 -
 34
34 -
 35
35 -
 36
36 -
 37
37 -
 38
38 -
 39
39 -
 40
40 -
 41
41 -
 42
42 -
 43
43 -
 44
44 -
 45
45 -
46
-
47
-
48
-
49
-
50
-
51
-
52
-
53
-
54
-
55
-
56
-
57
-
58
-
59
-
60
-
61
-
62
-
63
-
64
-
65
-
66
-
67
-
68
-
69
-
70
-
71
-
72
-
73
-
74
-
75
-
76
-
77
-
78
-
79
-
80
-
81
-
82
-
83
-
84
-
85
-
86
-
87
-
88
-
89
-
90
-
91
-
92
-
93
-
94
-
95
-
96
-
97
-
98
-
99
-
100
-
101
-
102
-
103
-
104
-
105
-
106
-
107
-
108
-
109
-
110
-
111
-
112
-
113
-
114
-
115
-
116
-
117
-
118
-
119
-
120
-
121
-
122
-
123
-
124
-
125
-
126
-
127
-
128
-
129
 |
 |

Table of Contents
In 2014 , the U.S. Outbound corridors generated 15 percent transaction growth and accounted for 40 percent of total money transfer transactions. The success in
the U.S. Outbound corridor was primarily driven by sends to Latin America, which had transaction growth of 16 percent for 2014 , as well as sends to Africa and
Asia Pacific. Non-U.S. transactions accounted for 37 percent of total money transfer transactions and generated 10 percent transaction growth. The growth was
primarily driven by the Middle East, Asia Pacific and Latin America. The U.S. to U.S. corridor declined 22 percent and accounted for 23 percent of total money
transfer transactions. The decline was primarily driven by a 37 percent decline in Walmart U.S. to U.S. transactions, partially offset by 10 percent growth in U.S. to
U.S. transactions excluding Walmart.
BillPaymentFeeandOtherRevenue
In 2015 and 2014 , bill payment fee and other revenue decreased $1.4 million or 1 percent and $1.9 million or 2 percent , respectively, as a result of lower average
fees resulting from shifts in industry mix, partially offset by transaction growth of 1 percent in 2015 and 2014 . The impact of changes in industry mix reflects our
continued growth in new emerging verticals that generate a lower fee per transaction than our traditional verticals.
Global Funds Transfer Commissions Expense
The Company incurs fee commissions primarily on our Global Funds Transfer products. In a money transfer transaction, both the agent initiating the transaction
and the receiving agent earn a commission that is generally based on a percentage of the fee charged to the consumer. In a bill payment transaction, the agent
initiating the transaction receives a commission and, in limited circumstances, the biller will generally earn a commission that is based on a percentage of the fee
charged to the consumer. Other commissions expense includes the amortization of capitalized agent signing bonus payments.
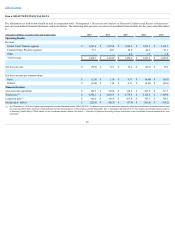
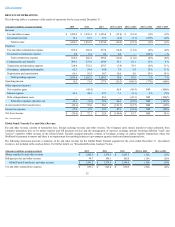
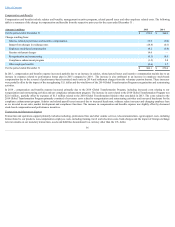
The following table details the changes in fee and other commissions for the Global Funds Transfer segment from the respective prior year for the years ended
December 31 :
(Amounts in millions) 2015
2014
For the period ended December 31: $ 665.4
$ 676.9
Change resulting from:
Impact from changes in exchange rates (29.4)
(2.2)
Money transfer revenue 22.9
(5.8)
Money transfer corridor and agent mix (12.6)
(14.2)
Signing bonuses 10.8
10.7
Bill payment revenue and commission rates (2.0)
—
For the period ended December 31: $ 655.1
$ 665.4
In 2015 , the Global Funds Transfer commissions expense decreased $10.3 million or 2 percent . The decrease in commissions expense was primarily driven by the
strengthening of the U.S. dollar and changes in the money transfer corridor and agent mix. The decline in commissions expense was partially offset by increased
money transfer revenue, as a result of an increase in money transfer volume offset by a decline in average face value per transaction and pricing previously
discussed above, as well as signing bonus amortization from our agent expansion and retention efforts. Commissions expense as a percentage of fee and other
revenue slightly declined to 48.1 percent in 2015 from 48.4 percent in 2014 due to a change in agent mix.
In 2014 , the Global Funds Transfer commissions expense decreased $11.5 million or 2 percent . The decrease in commissions expense was primarily driven by
changes in the corridor and agent mix and the movement in foreign currency exchange rates, partially offset by increased signing bonus amortization from our
agent expansion and retention efforts. Commissions expense as a percentage of fee and other revenue remained relatively stable at 48.4 percent and 48.7 percent ,
in 2014 and 2013 , respectively.
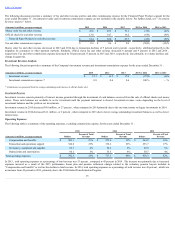
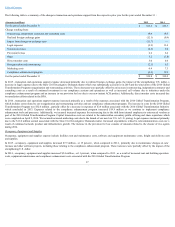
Financial Paper Products Fee and Other Revenue and Fee and Other Commissions Expense
Fee and other revenue consists of transaction fees, foreign exchange revenue and other revenue. Transaction fees are earned on money order and official check
transactions. Other revenue primarily consists of processing fees on rebate checks and controlled disbursements, service charges on aged outstanding money orders
and money order dispenser fees. We generally do not pay commissions to agents on the sale of money orders, except, in certain limited circumstances, for large
agents where we may pay a fixed commission based on total money order transactions.
34