MoneyGram 2015 Annual Report Download - page 43
Download and view the complete annual report
Please find page 43 of the 2015 MoneyGram annual report below. You can navigate through the pages in the report by either clicking on the pages listed below, or by using the keyword search tool below to find specific information within the annual report.-
 1
1 -
2
-
3
-
4
-
5
-
6
-
7
-
8
-
9
-
10
-
11
-
12
-
13
-
14
-
15
-
16
-
17
-
18
-
19
-
20
-
21
-
22
-
23
-
24
-
25
-
26
-
27
-
28
-
29
-
30
-
31
-
32
-
 33
33 -
 34
34 -
 35
35 -
 36
36 -
 37
37 -
 38
38 -
 39
39 -
 40
40 -
 41
41 -
 42
42 -
 43
43 -
 44
44 -
 45
45 -
 46
46 -
 47
47 -
 48
48 -
 49
49 -
 50
50 -
 51
51 -
 52
52 -
 53
53 -
54
-
55
-
56
-
57
-
58
-
59
-
60
-
61
-
62
-
63
-
64
-
65
-
66
-
67
-
68
-
69
-
70
-
71
-
72
-
73
-
74
-
75
-
76
-
77
-
78
-
79
-
80
-
81
-
82
-
83
-
84
-
85
-
86
-
87
-
88
-
89
-
90
-
91
-
92
-
93
-
94
-
95
-
96
-
97
-
98
-
99
-
100
-
101
-
102
-
103
-
104
-
105
-
106
-
107
-
108
-
109
-
110
-
111
-
112
-
113
-
114
-
115
-
116
-
117
-
118
-
119
-
120
-
121
-
122
-
123
-
124
-
125
-
126
-
127
-
128
-
129
 |
 |

Table of Contents
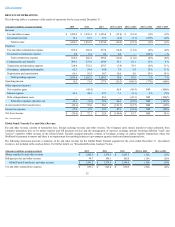
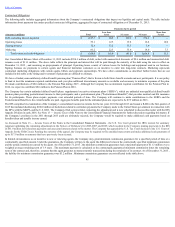
2014 Compared to 2013
For 2014 , the Company generated EBITDA of $226.1 million and Adjusted EBITDA of $277.2 million . When compared to 2013 , EBITDA remained stable. The
decline in revenue and the increase in the costs incurred for the 2014 Global Transformation Program were offset by a decrease in commissions expense and the
$45.4 million of net securities gains in 2014.
In 2014 , Adjusted EBITDA decreased $18.3 million , or 6 percent , as a result of a decline in average face value per transaction, pricing and an increase in
expenses for marketing.
For 2014 , Adjusted Free Cash Flow decreased $99.8 million , or 67 percent , to $50.0 million from $149.8 million in 2013 . The decrease was a result of an
increase of $48.9 million in cash paid for agent signing bonuses, an increase in cash paid for capital expenditures of $37.0 million primarily in connection with the
2014 Global Transformation Program, and overall fee and other revenue decline of 1 percent when compared to 2013 .
See " ResultsofOperations" and " AnalysisofCashFlows" sections for additional information regarding these changes.
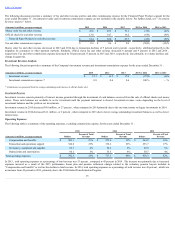
Acquisition and Disposal Activity
We did not complete any acquisitions in 2015.
LIQUIDITY AND CAPITAL RESOURCES
We have various resources available for purposes of managing liquidity and capital needs, including our investment portfolio, credit facilities and letters of credit.
We refer to our cash and cash equivalents, settlement cash and cash equivalents, interest-bearing investments and available-for-sale investments collectively as our
“investment portfolio.” The company utilizes cash and cash equivalents in various liquidity and capital assessments.
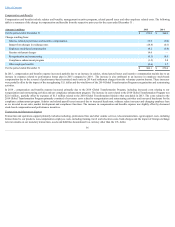
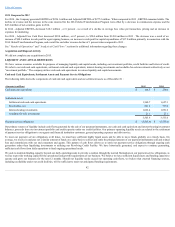
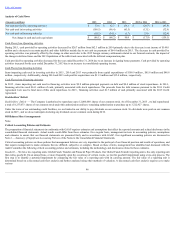
Cash and Cash Equivalents, Settlement Assets and Payment Service Obligations
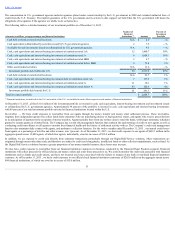
The following table shows the components of cash and cash equivalents and our settlement assets as of December 31 :
(Amounts in millions) 2015
2014
Cash and cash equivalents $ 164.5
$ 250.6
Settlement assets:
Settlement cash and cash equivalents 1,560.7
1,657.3
Receivables, net 861.4
757.6
Interest-bearing investments 1,062.4
1,091.6
Available-for-sale investments 21.1
27.1
3,505.6
3,533.6
Payment service obligations $ (3,505.6)
$ (3,533.6)
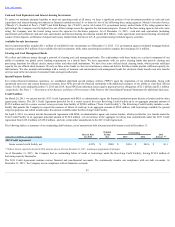
Our primary sources of liquidity include cash flows generated by the sale of our payment instruments, our cash and cash equivalent and interest-bearing investment
balances, proceeds from our investment portfolio and credit capacity under our credit facilities. Our primary operating liquidity needs are related to the settlement
of payment service obligations to our agents and financial institution customers, general operating expenses and debt service.
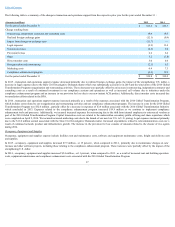
To meet our payment service obligations at all times, we must have sufficient highly liquid assets and be able to move funds globally on a timely basis. On
average, we receive in and pay out a similar amount of funds on a daily basis to collect and settle the principal amount of our payment instruments sold and related
fees and commissions with our end consumers and agents. This pattern of cash flows allows us to settle our payment service obligations through ongoing cash
generation rather than liquidating investments or utilizing our Revolving Credit Facility. We have historically generated, and expect to continue generating,
sufficient cash flows from daily operations to fund ongoing operational needs.
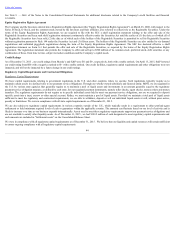
We seek to maintain funding capacity beyond our daily operating needs to provide a cushion through the normal fluctuations in our payment service obligations, as
well as to provide working capital for the operational and growth requirements of our business. We believe we have sufficient liquid assets and funding capacity to
operate and grow our business for the next 12 months. Should our liquidity needs exceed our operating cash flows, we believe that external financing sources,
including availability under our credit facilities, will be sufficient to meet our anticipated funding requirements.
42