MoneyGram 2015 Annual Report Download - page 40
Download and view the complete annual report
Please find page 40 of the 2015 MoneyGram annual report below. You can navigate through the pages in the report by either clicking on the pages listed below, or by using the keyword search tool below to find specific information within the annual report.-
 1
1 -
2
-
3
-
4
-
5
-
6
-
7
-
8
-
9
-
10
-
11
-
12
-
13
-
14
-
15
-
16
-
17
-
18
-
19
-
20
-
21
-
22
-
23
-
24
-
25
-
26
-
27
-
28
-
29
-
 30
30 -
 31
31 -
 32
32 -
 33
33 -
 34
34 -
 35
35 -
 36
36 -
 37
37 -
 38
38 -
 39
39 -
 40
40 -
 41
41 -
 42
42 -
 43
43 -
 44
44 -
 45
45 -
 46
46 -
 47
47 -
 48
48 -
 49
49 -
 50
50 -
51
-
52
-
53
-
54
-
55
-
56
-
57
-
58
-
59
-
60
-
61
-
62
-
63
-
64
-
65
-
66
-
67
-
68
-
69
-
70
-
71
-
72
-
73
-
74
-
75
-
76
-
77
-
78
-
79
-
80
-
81
-
82
-
83
-
84
-
85
-
86
-
87
-
88
-
89
-
90
-
91
-
92
-
93
-
94
-
95
-
96
-
97
-
98
-
99
-
100
-
101
-
102
-
103
-
104
-
105
-
106
-
107
-
108
-
109
-
110
-
111
-
112
-
113
-
114
-
115
-
116
-
117
-
118
-
119
-
120
-
121
-
122
-
123
-
124
-
125
-
126
-
127
-
128
-
129
 |
 |
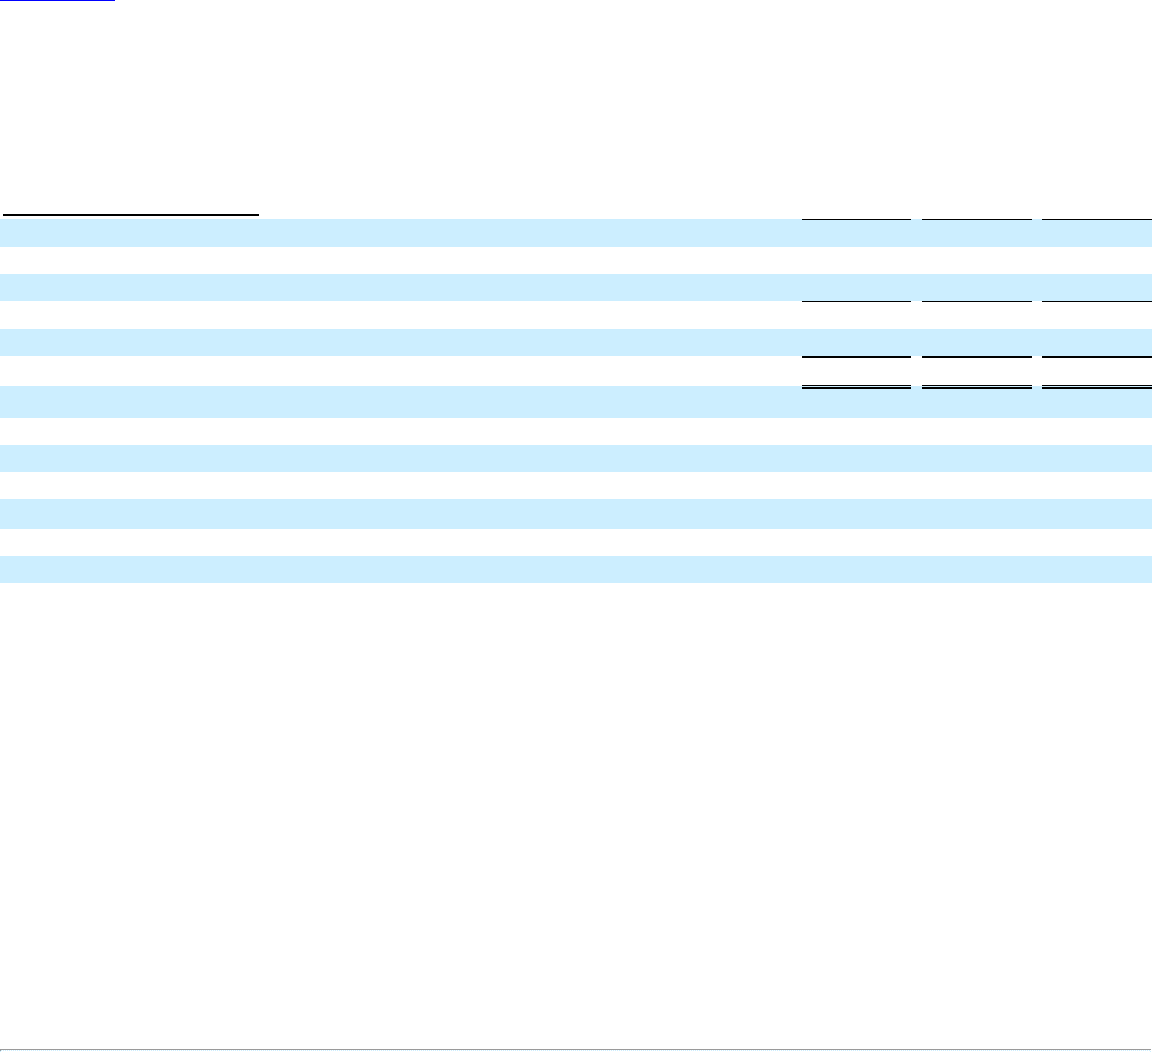
Table of Contents
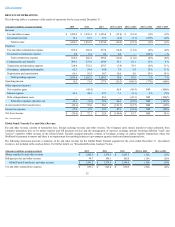
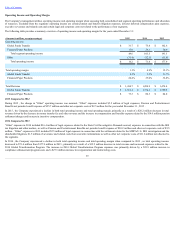
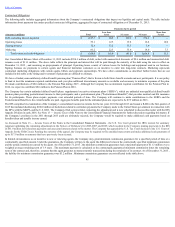
Operating Income and Operating Margin
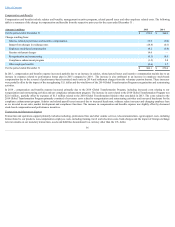
The Company's management utilizes operating income and operating margin when assessing both consolidated and segment operating performance and allocation
of resources. Excluded from the segments' operating income are certain pension and benefit obligation expenses, director deferred compensation plan expenses,
executive severance and related costs and certain legal and corporate costs not related to the performance of our segments.
The following table provides a summary overview of operating income and operating margin for the years ended December 31 :
(Amounts in millions, except percentages) 2015
2014
2013
Operating income:
Global Funds Transfer $ 31.7
$ 75.4
$ 162.6
Financial Paper Products 17.9
28.1
30.9
Total segment operating income 49.6
103.5
193.5
Other (33.4)
(32.1)
(15.6)
Total operating income $ 16.2
$ 71.4
$ 177.9
Total operating margin 1.1%
4.9%
12.1%
Global Funds Transfer 2.3%
5.5%
11.7%
Financial Paper Products 24.4%
35.0%
36.8%
Total Revenue $ 1,434.7
$ 1,454.9
$ 1,474.4
Global Funds Transfer $ 1,361.4
$ 1,374.6
$ 1,389.8
Financial Paper Products $ 73.3
$ 80.3
$ 84.0
2015 Compared to 2014
During 2015 , the change in "Other" operating income was nominal. “Other” expenses included $5.2 million of legal expenses, Pension and Postretirement
Benefits net periodic benefit expense of $25.7 million and other net corporate costs of $2.5 million for the year ended December 31 , 2015 .
In 2015 , the Company experienced a decline in both total operating income and total operating margin, primarily as a result of a $20.2 million decrease in total
revenue driven by the decrease in money transfer fee and other revenue and the increase in compensation and benefits expense related to the $14.0 million pension
settlement charges and increase in incentive compensation.
2014 Compared to 2013
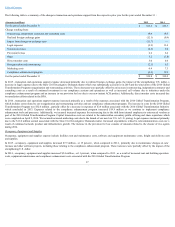
“Other” expenses in 2014 included $16.4 million of legal expenses related to the State Civil Investigative Demands accrual, expenses in connection with the IRS
tax litigation and other matters, as well as Pension and Postretirement Benefits net periodic benefit expense of $10.2 million and other net corporate costs of $5.5
million . “Other” expenses in 2013 included $2.5 million of legal expenses in connection with the settlement related to the MDPA/U.S. DOJ investigation and the
shareholder litigation, $1.5 million of severance and related costs from executive terminations as well as other net corporate costs of $11.6 million not allocated to
the segments.
In 2014 , the Company experienced a decline in both total operating income and total operating margin when compared to 2013 , as total operating income
decreased to $71.4 million from $177.9 million in 2013 , primarily as a result of a $19.5 million decrease in total revenue and increased expenses related to the
2014 Global Transformation Program. The increase in 2014 Global Transformation Program expenses was primarily driven by a $23.9 million increase in
compliance enhancement program costs and a $27.3 million increase in reorganization and restructuring costs.
39