MoneyGram 2015 Annual Report Download - page 34
Download and view the complete annual report
Please find page 34 of the 2015 MoneyGram annual report below. You can navigate through the pages in the report by either clicking on the pages listed below, or by using the keyword search tool below to find specific information within the annual report.-
 1
1 -
2
-
3
-
4
-
5
-
6
-
7
-
8
-
9
-
10
-
11
-
12
-
13
-
14
-
15
-
16
-
17
-
18
-
19
-
20
-
21
-
22
-
23
-
 24
24 -
 25
25 -
 26
26 -
 27
27 -
 28
28 -
 29
29 -
 30
30 -
 31
31 -
 32
32 -
 33
33 -
 34
34 -
 35
35 -
 36
36 -
 37
37 -
 38
38 -
 39
39 -
 40
40 -
 41
41 -
 42
42 -
 43
43 -
 44
44 -
45
-
46
-
47
-
48
-
49
-
50
-
51
-
52
-
53
-
54
-
55
-
56
-
57
-
58
-
59
-
60
-
61
-
62
-
63
-
64
-
65
-
66
-
67
-
68
-
69
-
70
-
71
-
72
-
73
-
74
-
75
-
76
-
77
-
78
-
79
-
80
-
81
-
82
-
83
-
84
-
85
-
86
-
87
-
88
-
89
-
90
-
91
-
92
-
93
-
94
-
95
-
96
-
97
-
98
-
99
-
100
-
101
-
102
-
103
-
104
-
105
-
106
-
107
-
108
-
109
-
110
-
111
-
112
-
113
-
114
-
115
-
116
-
117
-
118
-
119
-
120
-
121
-
122
-
123
-
124
-
125
-
126
-
127
-
128
-
129
 |
 |

Table of Contents
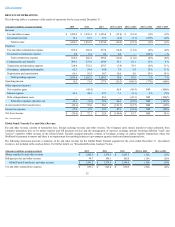
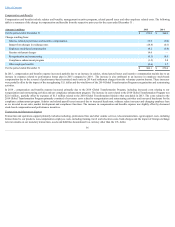
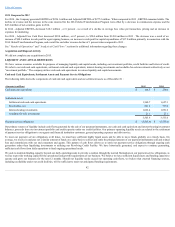
MoneyTransferFeeandOtherRevenue
The following table details the changes in money transfer fee and other revenue from the respective prior year for the years ended December 31 :
(Amounts in millions) 2015
2014
For the period ended December 31 $ 1,274.3
$ 1,287.5
Change resulting from:
Money transfer volume 83.2
29.5
Impact from changes in exchange rates (63.0)
(0.7)
Average face value per transaction and pricing (55.8)
(39.5)
Corridor mix 22.8
(2.5)
Other 1.0
—
For the period ended December 31 $ 1,262.5
$ 1,274.3
In 2015 , the decline in money transfer fee and other revenue was primarily driven by the strengthening of the U.S. dollar compared to the prior year, lower average
face value per transaction and pricing actions introduced in October 2014, partially offset by transaction growth of 7 percent and corridor mix. The transaction
growth was driven by the continued growth in the U.S. Outbound and Non-U.S. money transfer transactions, offset by the decline in our U.S. to U.S. money
transfer transactions as detailed further below.
In 2014 , the decline in money transfer fee and other revenue was primarily driven by the decline in our U.S. to U.S. business, lower average face value per
transaction, pricing actions introduced in October 2014 and corridor mix, partially offset by transaction growth of 2 percent . The low transaction growth was
driven by the decline in our U.S. to U.S. business primarily due the introduction of the Walmart white label money transfer service, which was offset by our
continued growth in the U.S. Outbound and Non-U.S money transfer transactions as detailed further below.
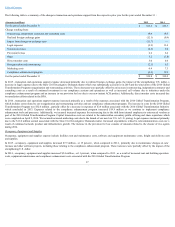
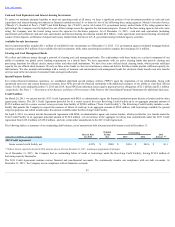
MoneyTransferTransactions
The following table displays the percentage distribution of total money transfer transactions by geographic location (the region originating the transaction) for the
years ended December 31 :
2015
2014
2013
U.S. to U.S. 17%
23%
30%
U.S. Outbound 43%
40%
36%
Non-U.S. 40%
37%
34%
The following table displays year over year money transfer transaction growth by geographic location (the region originating the transaction) for the years ended
December 31 :
2015 vs 2014
2014 vs 2013
Total transactions 7 %
2 %
U.S. to U.S. (18)%
(22)%
U.S. Outbound 12 %
15 %
Non-U.S. 16 %
10 %
In 2015 , the Non-U.S. corridors generated 16 percent transaction growth and accounted for 40 percent of our total money transfer transactions. The growth was
primarily driven by the Middle East, Western Europe and Latin America regions. U.S. Outbound corridors generated 12 percent transaction growth while
accounting for 43 percent of our total money transfer transactions. The success in the U.S. Outbound corridor was primarily driven by sends to Latin America and
to Africa. The U.S. to U.S. corridor declined 18 percent and accounted for 17 percent of our total money transfer transactions. The decline was primarily driven by
a 40 percent decline in Walmart U.S. to U.S. transactions, partially offset by 8 percent growth in U.S. to U.S. transactions excluding Walmart.
33