MoneyGram 2015 Annual Report Download - page 86
Download and view the complete annual report
Please find page 86 of the 2015 MoneyGram annual report below. You can navigate through the pages in the report by either clicking on the pages listed below, or by using the keyword search tool below to find specific information within the annual report.-
 1
1 -
2
-
3
-
4
-
5
-
6
-
7
-
8
-
9
-
10
-
11
-
12
-
13
-
14
-
15
-
16
-
17
-
18
-
19
-
20
-
21
-
22
-
23
-
24
-
25
-
26
-
27
-
28
-
29
-
30
-
31
-
32
-
33
-
34
-
35
-
36
-
37
-
38
-
39
-
40
-
41
-
42
-
43
-
44
-
45
-
46
-
47
-
48
-
49
-
50
-
51
-
52
-
53
-
54
-
55
-
56
-
57
-
58
-
59
-
60
-
61
-
62
-
63
-
64
-
65
-
66
-
67
-
68
-
69
-
70
-
71
-
72
-
73
-
74
-
75
-
 76
76 -
 77
77 -
 78
78 -
 79
79 -
 80
80 -
 81
81 -
 82
82 -
 83
83 -
 84
84 -
 85
85 -
 86
86 -
 87
87 -
 88
88 -
 89
89 -
 90
90 -
 91
91 -
 92
92 -
 93
93 -
 94
94 -
 95
95 -
 96
96 -
97
-
98
-
99
-
100
-
101
-
102
-
103
-
104
-
105
-
106
-
107
-
108
-
109
-
110
-
111
-
112
-
113
-
114
-
115
-
116
-
117
-
118
-
119
-
120
-
121
-
122
-
123
-
124
-
125
-
126
-
127
-
128
-
129
 |
 |
Table of Contents
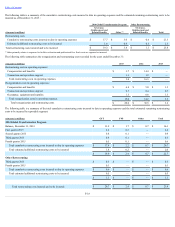
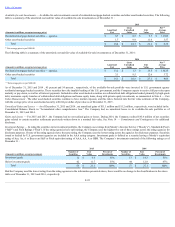
Available-for-saleInvestments— Available-for-sale investments consist of residential mortgage-backed securities and other asset-backed securities. The following
table is a summary of the amortized cost and fair value of available-for-sale investments as of December 31 :
2015
(Amounts in millions, except net average price)
Amortized
Cost
Gross
Unrealized
Gains
Fair
Value
Net (1)
Average
Price
Residential mortgage-backed securities — agencies $ 8.7
$ 0.8
$ 9.5
$ 111.00
Other asset-backed securities 1.7
9.9
11.6
3.57
Total $ 10.4
$ 10.7
$ 21.1
$ 6.32
(1) Net average price is per $100.00
The following table is a summary of the amortized cost and fair value of available-for-sale investments as of December 31, 2014 :
2014
(Amounts in millions, except net average price)
Amortized
Cost
Gross
Unrealized
Gains
Fair
Value
Net (1)
Average
Price
Residential mortgage-backed securities — agencies $ 13.2
$ 1.3
$ 14.5
$ 110.25
Other asset-backed securities 3.1
9.5
12.6
3.72
Total $ 16.3
$ 10.8
$ 27.1
$ 8.04
(1) Net average price is per $100.00
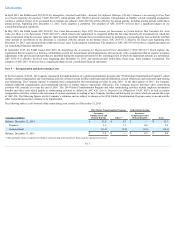
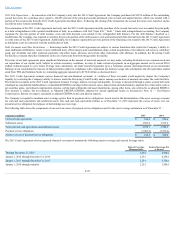
As of December 31, 2015 and 2014 , 45 percent and 54 percent , respectively, of the available-for-sale portfolio were invested in U.S. government agency
residential mortgage-backed securities. These securities have the implicit backing of the U.S. government, and the Company expects to receive full par value upon
maturity or pay-down, as well as all interest payments. Included in other asset-backed securities are collateralized debt obligations backed primarily by high-grade
debt, mezzanine equity tranches of collateralized debt obligations and home equity loans, along with private equity investments, as summarized in Note 4 — Fair
ValueMeasurement. The other asset-backed securities continue to have market exposure, and this risk is factored into the fair value estimates of the Company,
with the average price of an asset-backed security at $0.04 per dollar of par value as of December 31, 2015 .
UnrealizedGainsandLosses — As of December 31, 2015 and 2014 , net unrealized gains of $11.1 million and $11.2 million , respectively, were included in the
Consolidated Balance Sheets in “Accumulated other comprehensive loss.” The Company had no unrealized losses in its available-for-sale portfolio as of
December 31, 2015 and 2014 .
GainsandLosses— For 2015 and 2013 , the Company had no net realized gains or losses. During 2014, the Company realized $45.4 million of net securities
gains related to certain securities settlements previously written down to a nominal fair value. See Note 14 — CommitmentsandContingencies for additional
disclosure.
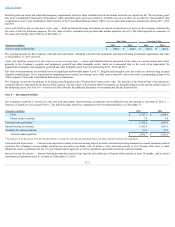
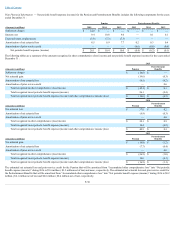
InvestmentRatings— In rating the securities in its investment portfolio, the Company uses ratings from Moody’s Investor Service (“Moody’s”), Standard & Poor's
(“S&P”) and Fitch Ratings (“Fitch”). If the rating agencies have split ratings, the Company uses the highest two out of three ratings across the rating agencies for
disclosure purposes. If none of the rating agencies have the same rating, the Company uses the lowest rating across the agencies for disclosure purposes. Securities
issued or backed by U.S. government agencies are included in the AAA rating category. Investment grade is defined as a security having a Moody’s equivalent
rating of Aaa, Aa, A or Baa or an S&P or Fitch equivalent rating of AAA, AA, A or BBB. The Company’s investments consisted of the following ratings as of
December 31 :
2015
2014
(Amounts in millions, except percentages)
Number of
Securities
Fair
Value
Percent of
Investments
Number of
Securities
Fair
Value
Percent of
Investments
Investment grade 12
$ 9.4
45%
13
$ 14.3
53%
Below investment grade 42
11.7
55%
44
12.8
47%
Total 54
$ 21.1
100%
57
$ 27.1
100%
Had the Company used the lowest rating from the rating agencies in the information presented above, there would be no change to the classifications in the above
table as of December 31, 2015 and 2014 , respectively.
F-22