MoneyGram 2015 Annual Report Download - page 36
Download and view the complete annual report
Please find page 36 of the 2015 MoneyGram annual report below. You can navigate through the pages in the report by either clicking on the pages listed below, or by using the keyword search tool below to find specific information within the annual report.
Table of Contents
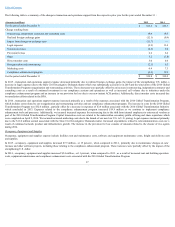
The following discussion provides a summary of fee and other revenue and fee and other commissions expense for the Financial Paper Product segment for the
years ended December 31 . Investment revenue and investment commissions expense are not included in the analysis below. For further detail, see " Investment
RevenueAnalysis" below.
(Amounts in millions, except percentages) 2015
2014
2013
2015 vs 2014
2014 vs 2013
Money order fee and other revenue $ 47.6
$ 49.3
$ 51.1
(3)%
(4)%
Official check fee and other revenue 13.8
14.7
16.2
(6)%
(9)%
Financial Paper Product fee and other revenue $ 61.4
$ 64.0
$ 67.3
(4)%
(5)%
Fee and other commissions expense $ 0.3
$ 0.6
$ 0.9
(50)%
(33)%
Money order fee and other revenue decreased in 2015 and 2014 due to transaction declines of 5 percent and 6 percent , respectively, attributed primarily to the
migration by consumers to other payment methods. Similarly, official check fee and other revenue decreased 6 percent and 9 percent in 2015 and 2014 ,
respectively. Fee and other commissions expense decreased by 50 percent and 33 percent in 2015 and 2014 , respectively, due primarily to volume declines and
change in agent mix.
Investment Revenue Analysis
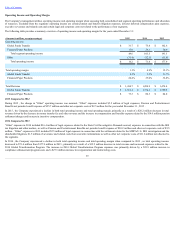
The following discussion provides a summary of the Company's investment revenue and investment commissions expense for the years ended December 31 :
(Amounts in millions, except percentages) 2015
2014
2013
2015 vs 2014
2014 vs 2013
Investment revenue $ 12.1
$ 16.5
$ 17.6
(27)%
(6)%
Investment commissions expense (1) 0.8
0.4
0.4
100 %
— %
(1) Commissions are generated from the average outstanding cash balances of official checks sold.
InvestmentRevenue
Investment revenue consists primarily of interest income generated through the investment of cash balances received from the sale of official checks and money
orders. These cash balances are available to us for investment until the payment instrument is cleared. Investment revenue varies depending on the level of
investment balances and the yield on our investments.
Investment revenue in 2015 decreased $4.4 million , or 27 percent , when compared to 2014 primarily due to the one-time returns on legacy investments in 2014.
Investment revenue in 2014 decreased $1.1 million , or 6 percent , when compared to 2013 due to lower average outstanding investment balances as well as lower
interest rates.
Operating Expenses
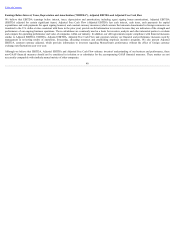
The following table is a summary of the operating expenses, excluding commissions expense, for the years ended December 31 :
2015
2014
2013
(Amounts in millions, except percentages) Dollars
Percent of Total
Revenue
Dollars
Percent of Total
Revenue
Dollars
Percent of Total
Revenue
Compensation and benefits $ 309.1
21%
$ 275.0
19%
$ 264.9
18%
Transaction and operations support 324.8
23%
332.2
23%
253.7
17%
Occupancy, equipment and supplies 62.3
4%
54.4
3%
49.0
3%
Depreciation and amortization 66.1
5%
55.5
4%
50.7
4%
Total operating expenses $ 762.3
53%
$ 717.1
49%
$ 618.3
42%
In 2015 , total operating expenses as a percentage of total revenue was 53 percent , compared to 49 percent in 2014 . The increase was primarily due to increased
expenses incurred as a result of the 2015 performance bonus plan and pension settlement charges related to the voluntary pension buyout included in
"Compensation and benefits" as well as the decline in total revenue. In 2014, total operating expenses as a percentage of total revenue was 49 percent , which was
an increase from 42 percent in 2013, primarily due to the 2014 Global Transformation Program.
35


