MoneyGram 2015 Annual Report Download - page 29
Download and view the complete annual report
Please find page 29 of the 2015 MoneyGram annual report below. You can navigate through the pages in the report by either clicking on the pages listed below, or by using the keyword search tool below to find specific information within the annual report.-
 1
1 -
2
-
3
-
4
-
5
-
6
-
7
-
8
-
9
-
10
-
11
-
12
-
13
-
14
-
15
-
16
-
17
-
18
-
 19
19 -
 20
20 -
 21
21 -
 22
22 -
 23
23 -
 24
24 -
 25
25 -
 26
26 -
 27
27 -
 28
28 -
 29
29 -
 30
30 -
 31
31 -
 32
32 -
 33
33 -
 34
34 -
 35
35 -
 36
36 -
 37
37 -
 38
38 -
 39
39 -
40
-
41
-
42
-
43
-
44
-
45
-
46
-
47
-
48
-
49
-
50
-
51
-
52
-
53
-
54
-
55
-
56
-
57
-
58
-
59
-
60
-
61
-
62
-
63
-
64
-
65
-
66
-
67
-
68
-
69
-
70
-
71
-
72
-
73
-
74
-
75
-
76
-
77
-
78
-
79
-
80
-
81
-
82
-
83
-
84
-
85
-
86
-
87
-
88
-
89
-
90
-
91
-
92
-
93
-
94
-
95
-
96
-
97
-
98
-
99
-
100
-
101
-
102
-
103
-
104
-
105
-
106
-
107
-
108
-
109
-
110
-
111
-
112
-
113
-
114
-
115
-
116
-
117
-
118
-
119
-
120
-
121
-
122
-
123
-
124
-
125
-
126
-
127
-
128
-
129
 |
 |

Table of Contents
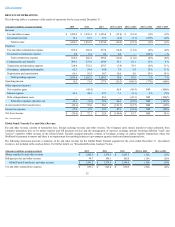
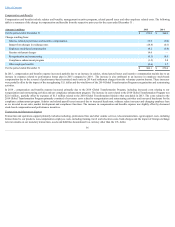
Item 6. SELECTED FINANCIAL DATA
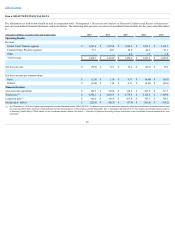
The information set forth below should be read in conjunction with “ Management’sDiscussionandAnalysisofFinancialConditionandResultsofOperations”
and our Consolidated Financial Statements and Notes thereto. The following table presents our selected consolidated financial data for the years ended December
31 :
(Amounts in millions, except per share and location data) 2015
2014
2013
2012
2011
Operating Results
Revenue
Global Funds Transfer segment $ 1,361.4
$ 1,374.6
$ 1,389.8
$ 1,255.2
$ 1,152.7
Financial Paper Products segment 73.3
80.3
84.0
84.5
93.3
Other —
—
0.6
1.5
1.8
Total revenue $ 1,434.7
$ 1,454.9
$ 1,474.4
$ 1,341.2
$ 1,247.8
Net (loss) income $ (76.9)
$ 72.1
$ 52.4
$ (49.3)
$ 59.4
Net (loss) income per common share:
Basic $ (1.24)
$ 1.10
$ 0.73
$ (0.69)
$ (9.03)
Diluted $ (1.24)
$ 1.10
$ 0.73
$ (0.69)
$ (9.03)
Financial Position
Cash and cash equivalents $ 164.5
$ 250.6
$ 318.8
$ 227.9
$ 211.7
Total assets (1) $ 4,505.2
$ 4,628.3
$ 4,775.8
$ 5,128.4
$ 5,149.0
Long-term debt (1) $ 942.6
$ 949.6
$ 831.8
$ 787.7
$ 784.3
Stockholders’ deficit $ (222.8)
$ (182.7)
$ (77.0)
$ (161.4)
$ (110.2)
(1) As of December 31, 2015, the Company early adopted Accounting Standards Update ("ASU") 2015-03. The amounts in prior periods have been adjusted to reflect the reclassification of the debt issuance costs
previously reported in Other assets as a direct deduction from the carrying amount of the Company's related debt liability. Also, in accordance with ASU 2015-15, the Company records debt issuance costs for
its Revolving Credit Facility in "Other assets" on the Consolidated Balance Sheets. See Note 2 — SummaryofSignificantAccountingPoliciesof the Notes to the Consolidated Financial Statements for more
information.
28