MoneyGram 2015 Annual Report Download - page 39
Download and view the complete annual report
Please find page 39 of the 2015 MoneyGram annual report below. You can navigate through the pages in the report by either clicking on the pages listed below, or by using the keyword search tool below to find specific information within the annual report.-
 1
1 -
2
-
3
-
4
-
5
-
6
-
7
-
8
-
9
-
10
-
11
-
12
-
13
-
14
-
15
-
16
-
17
-
18
-
19
-
20
-
21
-
22
-
23
-
24
-
25
-
26
-
27
-
28
-
 29
29 -
 30
30 -
 31
31 -
 32
32 -
 33
33 -
 34
34 -
 35
35 -
 36
36 -
 37
37 -
 38
38 -
 39
39 -
 40
40 -
 41
41 -
 42
42 -
 43
43 -
 44
44 -
 45
45 -
 46
46 -
 47
47 -
 48
48 -
 49
49 -
50
-
51
-
52
-
53
-
54
-
55
-
56
-
57
-
58
-
59
-
60
-
61
-
62
-
63
-
64
-
65
-
66
-
67
-
68
-
69
-
70
-
71
-
72
-
73
-
74
-
75
-
76
-
77
-
78
-
79
-
80
-
81
-
82
-
83
-
84
-
85
-
86
-
87
-
88
-
89
-
90
-
91
-
92
-
93
-
94
-
95
-
96
-
97
-
98
-
99
-
100
-
101
-
102
-
103
-
104
-
105
-
106
-
107
-
108
-
109
-
110
-
111
-
112
-
113
-
114
-
115
-
116
-
117
-
118
-
119
-
120
-
121
-
122
-
123
-
124
-
125
-
126
-
127
-
128
-
129
 |
 |

Table of Contents
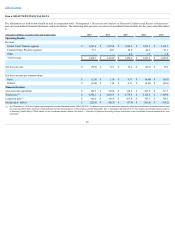
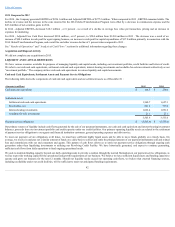
DepreciationandAmortization
Depreciation and amortization includes depreciation on computer hardware and software, agent signage, point of sale equipment, capitalized software development
costs, office furniture, equipment and leasehold improvements and amortization of intangible assets.
In 2015 , depreciation and amortization increased $10.6 million , or 19 percent , when compared to 2014 , primarily driven by higher depreciation expense due to
computer hardware and software asset additions related to the compliance enhancement program.
In 2014 , depreciation and amortization increased $4.8 million , or 10 percent , when compared to 2013 , primarily driven by higher amortization expense for
acquired assets and depreciation expense for computer hardware.
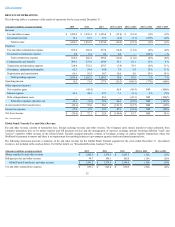
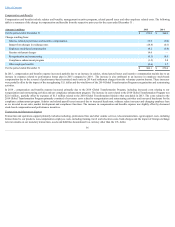
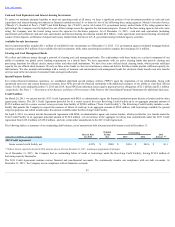
OtherExpenses(Income),Net
The following table is a summary of the components of other expenses (income), net for the years ended December 31 :
(Amounts in millions) 2015
2014
2013
2015 vs 2014
2014 vs 2013
Interest expense $ 45.3
$ 44.2
$ 47.3
$ 1.1
$ (3.1)
Net securities gains —
(45.4)
—
45.4
(45.4)
Debt extinguishment costs —
—
45.3
—
(45.3)
Total other expenses (income), net $ 45.3
$ (1.2)
$ 92.6
$ 46.5
$ (93.8)
InterestExpense—Interest expense in 2015 increased $1.1 million or 2 percent from 2014 as a result of higher average debt balances incurred in connection with
the Incremental Agreement, dated April 2, 2014. Interest expense decreased $3.1 million from $47.3 million in 2013 to $44.2 million in 2014 as a result of lower
interest rates from the 2013 Credit Agreement and the Company's purchase of all $325.0 million of its outstanding second lien notes in 2013 (the "Note
Repurchase"), partially offset by higher average debt balances incurred in connection with the Incremental Agreement. See Note 9 —Debtof the Notes to the
Consolidated Financial Statements for additional information.
NetSecuritiesGains—During 2015 and 2013 , we did not realize any net securities gains or losses. In 2014 , we realized $45.4 million of net securities gains for
settlements related to certain securities previously written down to a nominal fair value. See Note 14 — Commitments andContingencies of the Notes to the
Consolidated Financial Statements for additional disclosure.
DebtExtinguishmentCosts—During 2015 and 2014 , we did not incur any debt extinguishment costs. In connection with the termination of the Credit Agreement,
dated May 18, 2011, and the Note Repurchase, we recognized debt extinguishment costs of $45.3 million in the first quarter of 2013 . See Note 9 — Debtof the
Notes to the Consolidated Financial Statements for additional disclosure.
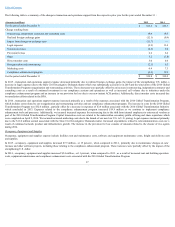
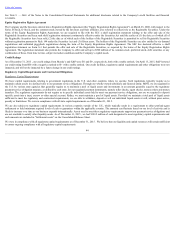
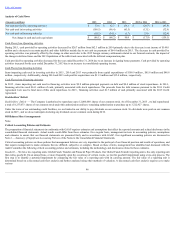
IncomeTaxes
The following table represents our provision for income taxes and effective tax rate for the years ended December 31 :
(Amounts in millions, except percentages)
2015
2014
2013
Provision for income taxes
$ 47.8
$ 0.5
$ 32.9
Effective tax rate
(164.3)%
0.6%
38.6%
Our provision for income taxes increased from 2014 to 2015 , primarily as a result of the court decision related to an IRS matter. As a result of the operating loss in
2015 , the effective tax rate was (164.3) percent . See Note 13 —IncomeTaxesand Note 14 —CommitmentsandContingenciesof the Notes to the Consolidated
Financial Statements for additional disclosure.
Our provision for income taxes and effective tax rate decreased from 2013 to 2014 , primarily resulting from the re-measurement of uncertain tax positions initially
recorded in 2012 , as well as a release of the valuation allowance on capital loss carryovers from net securities gains, which were partially offset by the reversal of
deferred tax benefits on canceled stock options.
Our provision for income taxes is volatile and could be affected by changes in the valuation of our deferred tax assets and liabilities, changes in tax laws and
regulations, ultimate settlements of the IRS matter referred to above and examinations by tax authorities. Historically, the Company has not asserted permanent
reinvestment with respect to its foreign undistributed earnings. To the extent such assertion changes in the future, our provision for income taxes and effective tax
rate may also change.
We are regularly examined by tax authorities both domestically and internationally. We assess the likelihood of adverse outcomes and believe that adequate
amounts have been reserved for adjustments that may result from these examinations. Given the inherent uncertainties in these examinations, the ultimate amount
and timing of adjustments cannot be assured.
38