MoneyGram 2015 Annual Report Download - page 33
Download and view the complete annual report
Please find page 33 of the 2015 MoneyGram annual report below. You can navigate through the pages in the report by either clicking on the pages listed below, or by using the keyword search tool below to find specific information within the annual report.-
 1
1 -
2
-
3
-
4
-
5
-
6
-
7
-
8
-
9
-
10
-
11
-
12
-
13
-
14
-
15
-
16
-
17
-
18
-
19
-
20
-
21
-
22
-
 23
23 -
 24
24 -
 25
25 -
 26
26 -
 27
27 -
 28
28 -
 29
29 -
 30
30 -
 31
31 -
 32
32 -
 33
33 -
 34
34 -
 35
35 -
 36
36 -
 37
37 -
 38
38 -
 39
39 -
 40
40 -
 41
41 -
 42
42 -
 43
43 -
44
-
45
-
46
-
47
-
48
-
49
-
50
-
51
-
52
-
53
-
54
-
55
-
56
-
57
-
58
-
59
-
60
-
61
-
62
-
63
-
64
-
65
-
66
-
67
-
68
-
69
-
70
-
71
-
72
-
73
-
74
-
75
-
76
-
77
-
78
-
79
-
80
-
81
-
82
-
83
-
84
-
85
-
86
-
87
-
88
-
89
-
90
-
91
-
92
-
93
-
94
-
95
-
96
-
97
-
98
-
99
-
100
-
101
-
102
-
103
-
104
-
105
-
106
-
107
-
108
-
109
-
110
-
111
-
112
-
113
-
114
-
115
-
116
-
117
-
118
-
119
-
120
-
121
-
122
-
123
-
124
-
125
-
126
-
127
-
128
-
129
 |
 |

Table of Contents
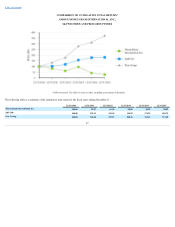
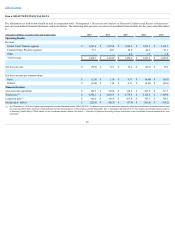
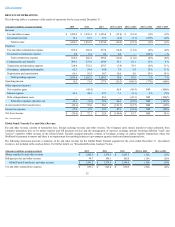
RESULTS OF OPERATIONS
The following table is a summary of the results of operations for the years ended December 31 :
(Amounts in millions, except percentages) 2015
2014
2013
2015 vs 2014
2014 vs 2013
2015 vs 2014
2014 vs 2013
Revenue
Fee and other revenue $ 1,422.6
$ 1,438.4
$ 1,456.8
$ (15.8)
$ (18.4)
(1)%
(1)%
Investment revenue 12.1
16.5
17.6
(4.4)
(1.1)
(27)%
(6)%
Total revenue 1,434.7
1,454.9
1,474.4
(20.2)
(19.5)
(1)%
(1)%
Expenses
Fee and other commissions expense 655.4
666.0
677.8
(10.6)
(11.8)
(2)%
(2)%
Investment commissions expense 0.8
0.4
0.4
0.4
—
100 %
— %
Total commissions expense 656.2
666.4
678.2
(10.2)
(11.8)
(2)%
(2)%
Compensation and benefits 309.1
275.0
264.9
34.1
10.1
12 %
4 %
Transaction and operations support 324.8
332.2
253.7
(7.4)
78.5
(2)%
31 %
Occupancy, equipment and supplies 62.3
54.4
49.0
7.9
5.4
15 %
11 %
Depreciation and amortization 66.1
55.5
50.7
10.6
4.8
19 %
10 %
Total operating expenses 1,418.5
1,383.5
1,296.5
35.0
87.0
3 %
7 %
Operating income 16.2
71.4
177.9
(55.2)
(106.5)
(77)%
(60)%
Other expenses (income)
Net securities gains —
(45.4)
—
45.4
(45.4)
NM
(100)%
Interest expense 45.3
44.2
47.3
1.1
(3.1)
2 %
(7)%
Debt extinguishment costs —
—
45.3
—
(45.3)
NM
(100)%
Total other expenses (income), net 45.3
(1.2)
92.6
46.5
(93.8)
NM
(101)%
(Loss) income before income taxes (29.1)
72.6
85.3
(101.7)
(12.7)
NM
(15)%
Income tax expense 47.8
0.5
32.9
47.3
(32.4)
NM
(98)%
Net (loss) income $ (76.9)
$ 72.1
$ 52.4
$ (149.0)
$ 19.7
NM
38 %
NM = Not meaningful
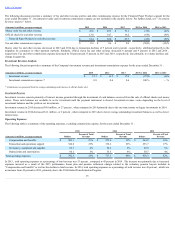
Global Funds Transfer Fee and Other Revenue
Fee and other revenue consists of transaction fees, foreign exchange revenue and other revenue. The Company earns money transfer revenues primarily from
consumer transaction fees on its money transfer and bill payment services and the management of currency exchange spreads involving different "send" and
"receive" countries. Other revenue in the Global Funds Transfer segment primarily consists of breakage revenue on money transfer transactions where the
likelihood of payment is remote and there is no requirement for remitting balances to government agencies under unclaimed property laws.
The following discussion provides a summary of fee and other revenue for the Global Funds Transfer segment for the years ended December 31 . Investment
revenue is not included in the analysis below. For further detail, see "Investment Revenue Analysis" below.
(Amounts in millions, except percentages) 2015
2014
2013
2015 vs 2014
2014 vs 2013
Money transfer fee and other revenue $ 1,262.5
$ 1,274.3
$ 1,287.5
(1)%
(1)%
Bill payment fee and other revenue 98.7
100.1
102.0
(1)%
(2)%
Global Funds Transfer fee and other revenue $ 1,361.2
$ 1,374.4
$ 1,389.5
(1)%
(1)%
Fee and other commissions expense $ 655.1
$ 665.4
$ 676.9
(2)%
(2)%
32