MoneyGram 2015 Annual Report Download - page 108
Download and view the complete annual report
Please find page 108 of the 2015 MoneyGram annual report below. You can navigate through the pages in the report by either clicking on the pages listed below, or by using the keyword search tool below to find specific information within the annual report.-
 1
1 -
2
-
3
-
4
-
5
-
6
-
7
-
8
-
9
-
10
-
11
-
12
-
13
-
14
-
15
-
16
-
17
-
18
-
19
-
20
-
21
-
22
-
23
-
24
-
25
-
26
-
27
-
28
-
29
-
30
-
31
-
32
-
33
-
34
-
35
-
36
-
37
-
38
-
39
-
40
-
41
-
42
-
43
-
44
-
45
-
46
-
47
-
48
-
49
-
50
-
51
-
52
-
53
-
54
-
55
-
56
-
57
-
58
-
59
-
60
-
61
-
62
-
63
-
64
-
65
-
66
-
67
-
68
-
69
-
70
-
71
-
72
-
73
-
74
-
75
-
76
-
77
-
78
-
79
-
80
-
81
-
82
-
83
-
84
-
85
-
86
-
87
-
88
-
89
-
90
-
91
-
92
-
93
-
94
-
95
-
96
-
97
-
 98
98 -
 99
99 -
 100
100 -
 101
101 -
 102
102 -
 103
103 -
 104
104 -
 105
105 -
 106
106 -
 107
107 -
 108
108 -
 109
109 -
 110
110 -
 111
111 -
 112
112 -
 113
113 -
 114
114 -
 115
115 -
 116
116 -
 117
117 -
 118
118 -
119
-
120
-
121
-
122
-
123
-
124
-
125
-
126
-
127
-
128
-
129
 |
 |

Table of Contents
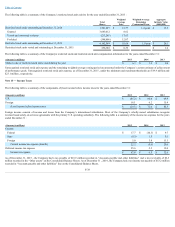
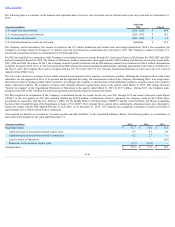
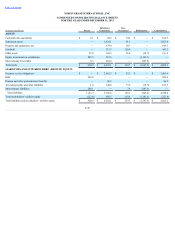
The following table is a summary of the total revenue by segment for the years ended December 31 :
(Amounts in millions) 2015
2014
2013
Global Funds Transfer revenue
Money transfer revenue $ 1,262.7
$ 1,274.5
$ 1,287.8
Bill payment revenue 98.7
100.1
102.0
Total Global Funds Transfer revenue 1,361.4
1,374.6
1,389.8
Financial Paper Products revenue
Money order revenue 51.0
54.1
55.1
Official check revenue 22.3
26.2
28.9
Total Financial Paper Products revenue 73.3
80.3
84.0
Other revenue —
—
0.6
Total revenue $ 1,434.7
$ 1,454.9
$ 1,474.4
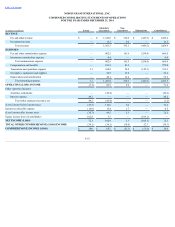
The following table is a summary of the operating income by segment and detail of the (loss) income before income taxes for the years ended December 31 :
(Amounts in millions) 2015
2014
2013
Global Funds Transfer operating income $ 31.7
$ 75.4
$ 162.6
Financial Paper Products operating income 17.9
28.1
30.9
Total segment operating income 49.6
103.5
193.5
Other operating loss (33.4)
(32.1)
(15.6)
Total operating income 16.2
71.4
177.9
Net securities gains —
45.4
—
Interest expense (45.3)
(44.2)
(47.3)
Debt extinguishment costs —
—
(45.3)
(Loss) income before income taxes $ (29.1)
$ 72.6
$ 85.3
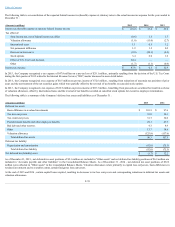
The following table is a summary of depreciation and amortization expense by segment for the years ended December 31 :
(Amounts in millions) 2015
2014
2013
Global Funds Transfer $ 60.4
$ 50.8
$ 46.5
Financial Paper Products 5.5
4.4
3.9
Other 0.2
0.3
0.3
Total depreciation and amortization $ 66.1
$ 55.5
$ 50.7
The following table is a summary of capital expenditures by segment for the years ended December 31 :
(Amounts in millions) 2015
2014
2013
Global Funds Transfer $ 70.1
$ 71.2
$ 49.3
Financial Paper Products 30.3
16.7
7.4
Total capital expenditures $ 100.4
$ 87.9
$ 56.7
F-44