MoneyGram 2015 Annual Report Download - page 85
Download and view the complete annual report
Please find page 85 of the 2015 MoneyGram annual report below. You can navigate through the pages in the report by either clicking on the pages listed below, or by using the keyword search tool below to find specific information within the annual report.-
 1
1 -
2
-
3
-
4
-
5
-
6
-
7
-
8
-
9
-
10
-
11
-
12
-
13
-
14
-
15
-
16
-
17
-
18
-
19
-
20
-
21
-
22
-
23
-
24
-
25
-
26
-
27
-
28
-
29
-
30
-
31
-
32
-
33
-
34
-
35
-
36
-
37
-
38
-
39
-
40
-
41
-
42
-
43
-
44
-
45
-
46
-
47
-
48
-
49
-
50
-
51
-
52
-
53
-
54
-
55
-
56
-
57
-
58
-
59
-
60
-
61
-
62
-
63
-
64
-
65
-
66
-
67
-
68
-
69
-
70
-
71
-
72
-
73
-
74
-
 75
75 -
 76
76 -
 77
77 -
 78
78 -
 79
79 -
 80
80 -
 81
81 -
 82
82 -
 83
83 -
 84
84 -
 85
85 -
 86
86 -
 87
87 -
 88
88 -
 89
89 -
 90
90 -
 91
91 -
 92
92 -
 93
93 -
 94
94 -
 95
95 -
96
-
97
-
98
-
99
-
100
-
101
-
102
-
103
-
104
-
105
-
106
-
107
-
108
-
109
-
110
-
111
-
112
-
113
-
114
-
115
-
116
-
117
-
118
-
119
-
120
-
121
-
122
-
123
-
124
-
125
-
126
-
127
-
128
-
129
 |
 |

Table of Contents
Realized gains and losses and other-than-temporary impairments related to these available-for-sale investment securities are reported in the "Net securities gains"
line in the Consolidated Statements of Operations, while unrealized gains and losses related to available-for-sale securities are recorded in "Accumulated other
comprehensive loss" in the stockholders' deficit section of the Consolidated Balance Sheets. There were no other-than-temporary impairments during 2015 , 2014
and 2013 .
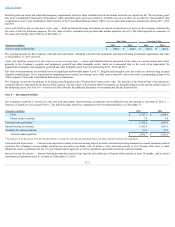
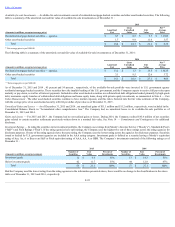
Assetsandliabilitiesthataredisclosedatfairvalue— Debt and interest-bearing investments are carried at amortized cost; however, the Company estimates the
fair value of debt for disclosure purposes. The fair value of debt is estimated using an observable market quotation (Level 2). The following table is a summary of
fair value and carrying value of debt as of December 31 :
Fair Value
Carrying Value
(Amounts in millions) 2015
2014
2015
2014
Senior secured credit facility $ 858.9
$ 884.0
$ 954.3
$ 963.5
The carrying amounts for the Company's cash and cash equivalents, settlement cash and cash equivalents and interest-bearing investments approximate fair value
as of December 31, 2015 and 2014 .
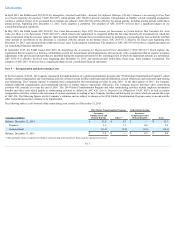
Assets and liabilities measured at fair value on a non-recurring basis — Assets and liabilities that are measured at fair value on a non-recurring basis relate
primarily to the Company’s property and equipment, goodwill and other intangible assets, which are re-measured only in the event of an impairment. No
impairments of property and equipment, goodwill and other intangible assets were recorded during 2015 , 2014 and 2013 .
Fair value re-measurements are normally based on significant unobservable inputs (Level 3). Tangible and intangible asset fair values are derived using accepted
valuation methodologies. If it is determined an impairment has occurred, the carrying value of the asset is reduced to fair value with a corresponding charge to the
"Other expenses" line in the Consolidated Statements of Operations.
The Company records the investments in its defined benefit pension plan ("Pension Plan") trust at fair value. The majority of the Pension Plan’s investments are
common/collective trusts held by the Pension Plan’s trustee. The fair values of the Pension Plan's investments are determined based on the current market values of
the underlying assets. See Note 10 — PensionandOtherBenefitsfor additional disclosure of investments held by the Pension Plan.
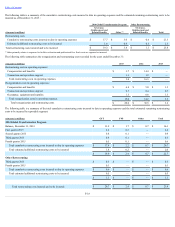
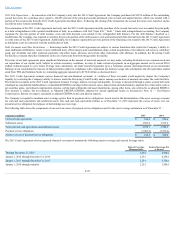
Note 5 — Investment Portfolio
The Company’s portfolio is invested in cash and cash equivalents, interest-bearing investments and available-for-sale investments as described in Note 2 —
SummaryofSignificantAccountingPolicies. The following table shows the components of the investment portfolio as of December 31 :
(Amounts in millions) 2015
2014
Cash $ 1,717.3
$ 1,898.1
Money market securities 7.9
9.8
Cash and cash equivalents (1) 1,725.2
1,907.9
Interest-bearing investments 1,062.4
1,091.6
Available-for-sale investments 21.1
27.1
Total investment portfolio $ 2,808.7
$ 3,026.6
(1) For purposes of the discussion of the investment portfolio as a whole, the cash and cash equivalents balance includes settlement cash and cash equivalents.
CashandCashEquivalents — Cash and cash equivalents consist of interest-bearing deposit accounts, non-interest bearing transaction accounts and money market
securities. The Company’s money market securities are invested in two funds, each of which is AAA rated and consists of U.S. Treasury bills, notes or other
obligations issued or guaranteed by the U.S. government and its agencies, as well as repurchase agreements secured by such instruments.
Interest-bearingInvestments — Interest-bearing investments consist of time deposits and certificates of deposit with maturities of up to 24 months , and are issued
from financial institutions rated A- or better as of December 31, 2015 .
F-21