MoneyGram 2015 Annual Report Download - page 120
Download and view the complete annual report
Please find page 120 of the 2015 MoneyGram annual report below. You can navigate through the pages in the report by either clicking on the pages listed below, or by using the keyword search tool below to find specific information within the annual report.-
 1
1 -
2
-
3
-
4
-
5
-
6
-
7
-
8
-
9
-
10
-
11
-
12
-
13
-
14
-
15
-
16
-
17
-
18
-
19
-
20
-
21
-
22
-
23
-
24
-
25
-
26
-
27
-
28
-
29
-
30
-
31
-
32
-
33
-
34
-
35
-
36
-
37
-
38
-
39
-
40
-
41
-
42
-
43
-
44
-
45
-
46
-
47
-
48
-
49
-
50
-
51
-
52
-
53
-
54
-
55
-
56
-
57
-
58
-
59
-
60
-
61
-
62
-
63
-
64
-
65
-
66
-
67
-
68
-
69
-
70
-
71
-
72
-
73
-
74
-
75
-
76
-
77
-
78
-
79
-
80
-
81
-
82
-
83
-
84
-
85
-
86
-
87
-
88
-
89
-
90
-
91
-
92
-
93
-
94
-
95
-
96
-
97
-
98
-
99
-
100
-
101
-
102
-
103
-
104
-
105
-
106
-
107
-
108
-
109
-
 110
110 -
 111
111 -
 112
112 -
 113
113 -
 114
114 -
 115
115 -
 116
116 -
 117
117 -
 118
118 -
 119
119 -
 120
120 -
 121
121 -
 122
122 -
 123
123 -
 124
124 -
 125
125 -
 126
126 -
 127
127 -
 128
128 -
 129
129
 |
 |
Table of Contents
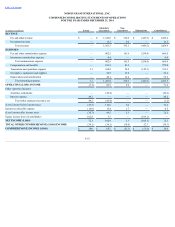
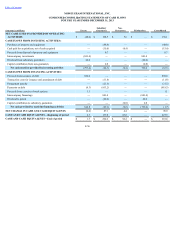
MONEYGRAM INTERNATIONAL, INC.
CONDENSED CONSOLIDATING STATEMENTS OF CASH FLOWS
FOR THE YEAR ENDED DECEMBER 31, 2013
(Amounts in millions) Parent
Subsidiary
Guarantors
Non-
Guarantors
Eliminations
Consolidated
NET CASH (USED IN) PROVIDED BY OPERATING
ACTIVITIES $ (48.0)
$ 198.5
$ 5.6
$ —
$ 156.1
CASH FLOWS FROM INVESTING ACTIVITIES:
Purchases of property and equipment —
(48.8)
—
—
(48.8)
Cash paid for acquisitions, net of cash acquired —
(15.0)
(0.4)
—
(15.4)
Proceeds from disposal of property and equipment —
0.7
—
—
0.7
Intercompany investments (841.4)
—
—
841.4
—
Dividend from subsidiary guarantors 44.0
—
—
(44.0)
—
Capital contribution from non-guarantors —
0.8
—
(0.8)
—
Net cash (used in) provided by investing activities (797.4)
(62.3)
(0.4)
796.6
(63.5)
CASH FLOWS FROM FINANCING ACTIVITIES:
Proceeds from issuance of debt 850.0
—
—
—
850.0
Transaction costs for issuance and amendment of debt —
(11.8)
—
—
(11.8)
Prepayment penalty —
(21.5)
—
—
(21.5)
Payments on debt (6.3)
(813.2)
—
—
(819.5)
Proceeds from exercise of stock options 1.1
—
—
—
1.1
Intercompany financings —
841.4
—
(841.4)
—
Dividend to parent —
(44.0)
—
44.0
—
Capital contribution to subsidiary guarantors —
—
(0.8)
0.8
—
Net cash provided by (used in) financing activities 844.8
(49.1)
(0.8)
(796.6)
(1.7)
NET CHANGE IN CASH AND CASH EQUIVALENTS (0.6)
87.1
4.4
—
90.9
CASH AND CASH EQUIVALENTS—Beginning of period 2.3
137.8
87.8
—
227.9
CASH AND CASH EQUIVALENTS—End of period $ 1.7
$ 224.9
$ 92.2
$ —
$ 318.8
F-56