MoneyGram 2015 Annual Report Download - page 52
Download and view the complete annual report
Please find page 52 of the 2015 MoneyGram annual report below. You can navigate through the pages in the report by either clicking on the pages listed below, or by using the keyword search tool below to find specific information within the annual report.-
 1
1 -
2
-
3
-
4
-
5
-
6
-
7
-
8
-
9
-
10
-
11
-
12
-
13
-
14
-
15
-
16
-
17
-
18
-
19
-
20
-
21
-
22
-
23
-
24
-
25
-
26
-
27
-
28
-
29
-
30
-
31
-
32
-
33
-
34
-
35
-
36
-
37
-
38
-
39
-
40
-
41
-
 42
42 -
 43
43 -
 44
44 -
 45
45 -
 46
46 -
 47
47 -
 48
48 -
 49
49 -
 50
50 -
 51
51 -
 52
52 -
 53
53 -
 54
54 -
 55
55 -
 56
56 -
 57
57 -
 58
58 -
 59
59 -
 60
60 -
 61
61 -
 62
62 -
63
-
64
-
65
-
66
-
67
-
68
-
69
-
70
-
71
-
72
-
73
-
74
-
75
-
76
-
77
-
78
-
79
-
80
-
81
-
82
-
83
-
84
-
85
-
86
-
87
-
88
-
89
-
90
-
91
-
92
-
93
-
94
-
95
-
96
-
97
-
98
-
99
-
100
-
101
-
102
-
103
-
104
-
105
-
106
-
107
-
108
-
109
-
110
-
111
-
112
-
113
-
114
-
115
-
116
-
117
-
118
-
119
-
120
-
121
-
122
-
123
-
124
-
125
-
126
-
127
-
128
-
129
 |
 |

Table of Contents
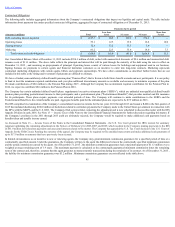
The concentration in U.S. government agencies includes agencies placed under conservatorship by the U.S. government in 2008 and extended unlimited lines of
credit from the U.S. Treasury. The implicit guarantee of the U.S. government and its actions to date support our belief that the U.S. government will honor the
obligations of its agencies if the agencies are unable to do so themselves.
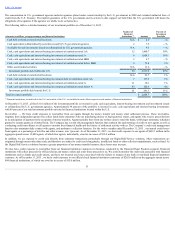
The following table is a detailed summary of our investment portfolio as of December 31, 2015 :
(Amounts in millions, except percentages and financial institutions)
Number of
Financial
Institutions (1)
Amount
Percent of
Investment
Portfolio
Cash held on-hand at owned retail locations N/A
$ 4.9
—%
Cash equivalents collateralized by securities issued by U.S. government agencies 2
7.9
—%
Available-for-sale investments issued or collateralized by U.S. government agencies N/A
9.5
—%
Cash, cash equivalents and interest-bearing investments at institutions rated AA 12
1,400.7
50%
Cash, cash equivalents and interest-bearing investments at institutions rated A 6
1,004.3
36%
Cash, cash equivalents and interest-bearing investments at institutions rated BBB 2
4.7
—%
Cash, cash equivalents and interest-bearing investments at institutions rated below BBB 8
73.8
3%
Other asset-backed securities N/A
11.6
—%
Investment portfolio held within the U.S. 30
2,517.4
89%
Cash held on-hand at owned retail locations N/A
23.7
1%
Cash, cash equivalents and interest-bearing investments held at institutions rated AA 7
137.2
5%
Cash, cash equivalents and interest-bearing investments at institutions rated A 11
30.1
1%
Cash, cash equivalents and interest-bearing investments at institutions rated below A 43
100.3
4%
Investment portfolio held outside the U.S. 61
291.3
11%
Total investment portfolio
$ 2,808.7
100%
(1) Financial institutions, located both in the U.S. and outside of the U.S., are included in each of their respective total number of financial institutions.
At December 31, 2015 , all but $11.6 million of the investment portfolio is invested in cash, cash equivalents, interest-bearing investments and investments issued
or collateralized by U.S. government agencies. Approximately 98 percent of the portfolio is invested in cash, cash equivalents and interest-bearing investments,
with 89 percent of our total investment portfolio invested at financial institutions located within the U.S.
Receivables — We have credit exposure to receivables from our agents through the money transfer and money order settlement process. These receivables
originate from independent agents who collect funds from consumers who are transferring money or buying money orders, and agents who receive proceeds from
us in anticipation of payment to the recipients of money transfers. Agents typically have from one to three days to remit the funds, with longer remittance schedules
granted to certain agents on a limited basis. The Company has a credit risk management function that conducts the underwriting of credit on new agents as well as
conducting credit surveillance on all agents to monitor their financial health and the history of settlement activity with us. The Company’s credit risk management
function also maintains daily contact with agents, and performs a collection function. For the twelve months ended December 31, 2015 , our annual credit losses
from agents, as a percentage of total fee and other revenue, was 1 percent . As of December 31, 2015 , we had credit exposure to our agents of $652.1 million in the
aggregate spread across 15,888 agents, of which four agents, individually, owed us in excess of $15.0 million .
In addition, we are exposed to credit risk directly from consumer transactions particularly through our Digital/Self-Service solutions, where transactions are
originated through means other than cash, and therefore are subject to credit card chargebacks, insufficient funds or other collection impediments, such as fraud. As
the Digital/Self-Service solutions become a greater proportion of our money transfer business, these losses may increase.
We also have credit exposure to receivables from our financial institution customers for business conducted by the Financial Paper Products segment. Financial
institutions will collect proceeds for official checks and money orders and remit those proceeds to us. We actively monitor the credit risk associated with financial
institutions such as banks and credit unions, and have not incurred any losses associated with the failure or merger of any bank or non-bank financial institution
customer. As of December 31, 2015 , we had a credit exposure to our official check financial institution customers of $265.0 million in the aggregate spread across
904 financial institutions, of which one owed us in excess of $15.0 million .
51