MoneyGram 2015 Annual Report Download - page 100
Download and view the complete annual report
Please find page 100 of the 2015 MoneyGram annual report below. You can navigate through the pages in the report by either clicking on the pages listed below, or by using the keyword search tool below to find specific information within the annual report.-
 1
1 -
2
-
3
-
4
-
5
-
6
-
7
-
8
-
9
-
10
-
11
-
12
-
13
-
14
-
15
-
16
-
17
-
18
-
19
-
20
-
21
-
22
-
23
-
24
-
25
-
26
-
27
-
28
-
29
-
30
-
31
-
32
-
33
-
34
-
35
-
36
-
37
-
38
-
39
-
40
-
41
-
42
-
43
-
44
-
45
-
46
-
47
-
48
-
49
-
50
-
51
-
52
-
53
-
54
-
55
-
56
-
57
-
58
-
59
-
60
-
61
-
62
-
63
-
64
-
65
-
66
-
67
-
68
-
69
-
70
-
71
-
72
-
73
-
74
-
75
-
76
-
77
-
78
-
79
-
80
-
81
-
82
-
83
-
84
-
85
-
86
-
87
-
88
-
89
-
 90
90 -
 91
91 -
 92
92 -
 93
93 -
 94
94 -
 95
95 -
 96
96 -
 97
97 -
 98
98 -
 99
99 -
 100
100 -
 101
101 -
 102
102 -
 103
103 -
 104
104 -
 105
105 -
 106
106 -
 107
107 -
 108
108 -
 109
109 -
 110
110 -
111
-
112
-
113
-
114
-
115
-
116
-
117
-
118
-
119
-
120
-
121
-
122
-
123
-
124
-
125
-
126
-
127
-
128
-
129
 |
 |

Table of Contents
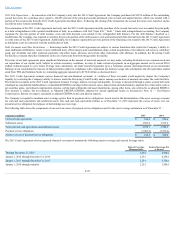
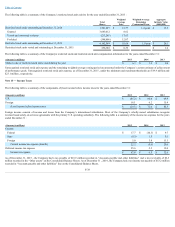
For purposes of determining the fair value of stock option awards, the Company uses the Black-Scholes single option pricing model for time-based and
performance-based tranches. The following table provides weighted-average grant-date fair value and assumptions utilized to estimate the grant-date fair value of
the options granted during the years ended December 31 :
2014
2013
Expected dividend yield (1) 0.0%
0.0%
Expected volatility (2) 64.6% - 68.2%
68.2%-69.0%
Risk-free interest rate (3) 1.1% - 2.1%
1.1%-1.2%
Expected life (4) 6.0 - 6.3 years
6.3 years
Weighted-average grant-date fair value per option $10.99
$10.51
(1) Expected dividend yield represents the level of dividends expected to be paid on the Company’s common stock over the expected term of the option. The Company does not anticipate
declaring any dividends at this time.
(2) Expected volatility is the amount by which the Company’s stock price has fluctuated or will fluctuate during the expected term of the option. The Company’s expected volatility is
calculated based on the historical volatility of the price of the Company’s common stock since the spin-off from Viad Corporation on June 30, 2004. The Company also considers any
known or anticipated factors that will likely impact future volatility.
(3) The risk-free interest rate for the Black-Scholes model is based on the U.S. Treasury yield curve in effect at the time of grant for periods within the expected term of the option.
(4) Expected life represents the period of time that options are expected to be outstanding. The expected life was determined using the simplified method as the pattern of changes in the
value of the Company’s common stock and exercise activity since late 2007 has been inconsistent and substantially different from historical patterns. Additionally, there have been
minimal stock option exercises which would be representative of the Company’s normal exercise activity since 2007. Accordingly, the Company does not believe that historical terms
are relevant to the assessment of the expected term of the grant. Based on these factors, the Company does not believe that it has the ability to make a more refined estimate than the use
of the simplified method.
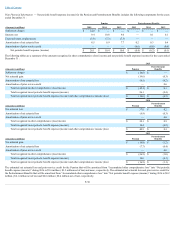
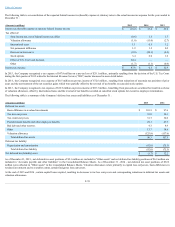
The following table is a summary of the Company’s stock option activity for the year ended December 31, 2015 :
Shares
Weighted-
Average
Exercise
Price
Weighted-
Average
Remaining
Contractual
Term
Aggregate
Intrinsic
Value
($000,000)
Options outstanding at December 31, 2014 3,786,458
$ 19.57
6.3 years
$ —
Forfeited/Expired (693,877)
21.24
Options outstanding at December 31, 2015 3,092,581
$ 19.20
5.2 years
$ —
Vested or expected to vest at December 31, 2015 3,044,556
$ 19.23
5.2 years
$ —
Options exercisable at December 31, 2015 2,200,813
$ 18.97
4.5 years
$ —
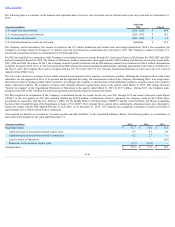
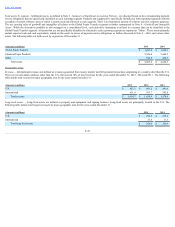
The following table is a summary of the Company's stock option compensation information during years ended December 31 :
(Amounts in millions) 2015
2014
2013
Intrinsic value of options exercised $ —
$ 0.1
$ 0.1
Cash received from option exercises $ —
$ 0.4
$ 1.1
Unrecognized stock option expense $ 4.2
Remaining weighted-average vesting period 0.7 years
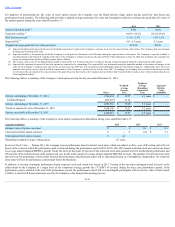
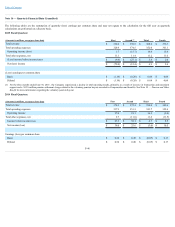
RestrictedStockUnits— During 2013, the Company issued performance-based restricted stock units, which are subject to three -year cliff vesting and will vest
based on the extent to which the performance goal is achieved during the performance period (2013-2015). The 2013 annual restricted stock unit awards are based
on average annual Adjusted EBITDA growth. Under the terms of the grant, 50 percent of the restricted stock units granted will vest for threshold performance and
100 percent of the restricted stock units granted will vest for the achievement of average annual Adjusted EBITDA at target. The number of restricted stock units
that will vest for performance achievement between the performance threshold and target will be determined based on a straight-line interpolation. No restricted
stock units will vest for performance achievement below the threshold.
In addition, a one-time contingent performance-based restricted stock unit award was issued in 2013. Vesting of the one-time contingent award is based on the
achievement by the Company of a target level of the compound average growth rate ("CAGR") of revenue during the three year performance period. If the
performance goal is attained at the end of the performance period, the performance award will vest and eligible participants will receive the value of their award.
CAGR is a non-GAAP financial measure used by the Company in the budget and reporting process.
F-36