MoneyGram 2007 Annual Report Download - page 99
Download and view the complete annual report
Please find page 99 of the 2007 MoneyGram annual report below. You can navigate through the pages in the report by either clicking on the pages listed below, or by using the keyword search tool below to find specific information within the annual report.-
 1
1 -
2
-
3
-
4
-
5
-
6
-
7
-
8
-
9
-
10
-
11
-
12
-
13
-
14
-
15
-
16
-
17
-
18
-
19
-
20
-
21
-
22
-
23
-
24
-
25
-
26
-
27
-
28
-
29
-
30
-
31
-
32
-
33
-
34
-
35
-
36
-
37
-
38
-
39
-
40
-
41
-
42
-
43
-
44
-
45
-
46
-
47
-
48
-
49
-
50
-
51
-
52
-
53
-
54
-
55
-
56
-
57
-
58
-
59
-
60
-
61
-
62
-
63
-
64
-
65
-
66
-
67
-
68
-
69
-
70
-
71
-
72
-
73
-
74
-
75
-
76
-
77
-
78
-
79
-
80
-
81
-
82
-
83
-
84
-
85
-
86
-
87
-
88
-
 89
89 -
 90
90 -
 91
91 -
 92
92 -
 93
93 -
 94
94 -
 95
95 -
 96
96 -
 97
97 -
 98
98 -
 99
99 -
 100
100 -
 101
101 -
 102
102 -
 103
103 -
 104
104 -
 105
105 -
 106
106 -
 107
107 -
 108
108 -
 109
109 -
110
-
111
-
112
-
113
-
114
-
115
-
116
-
117
-
118
-
119
-
120
-
121
-
122
-
123
-
124
-
125
-
126
-
127
-
128
-
129
-
130
-
131
-
132
-
133
-
134
-
135
-
136
-
137
-
138
-
139
-
140
-
141
-
142
-
143
-
144
-
145
-
146
-
147
-
148
-
149
-
150
-
151
-
152
-
153
-
154
-
155
-
156
-
157
-
158
-
159
-
160
-
161
-
162
-
163
-
164
 |
 |
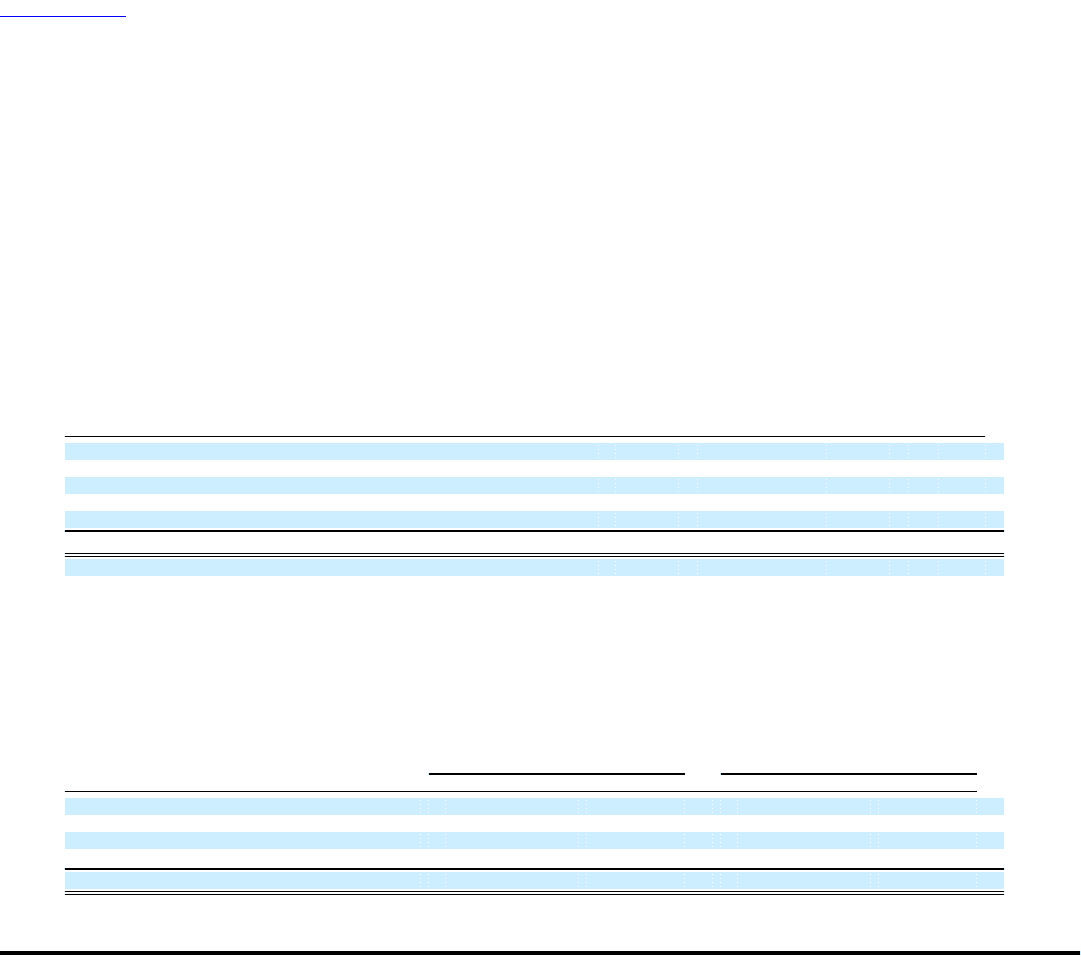
Table of Contents
MONEYGRAM INTERNATIONAL, INC. AND SUBSIDIARIES
NOTES TO CONSOLIDATED FINANCIAL STATEMENTS — (Continued)
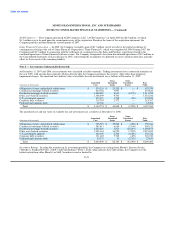
At December 31, 2007, "Other asset-backed securities" with a fair value of $1,318.2 million had gross unrealized gains of $9.5 million,
which includes gross unrealized gains of less than $0.1 million for securities with direct exposure to sub-prime mortgages as collateral.
These unrealized gains are included in the Consolidated Balance Sheet in "Accumulated other comprehensive loss."
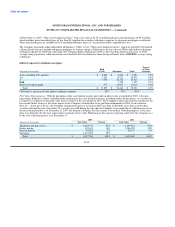
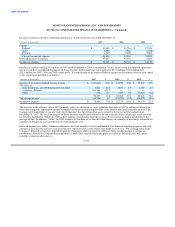
The Company also holds collateralized debt obligations ("CDOs") in its "Other asset-backed securities" which are backed by diversified
collateral pools that may include sub-prime mortgages of various vintages. Following is the fair value of CDOs with indirect sub-prime
mortgage exposure by CDO type and rating. The Company defines high grade CDOs as those having collateral with an A- or better
average rating at purchase, while mezzanine asset-backed CDOs are defined as those having collateral with a BBB/BBB- average rating
at purchase.
Indirect exposure to subprime mortgages
Percent
High of Total
(Amounts in thousands) Grade Mezzanine Total Portfolio
AAA, including U.S. agencies $ 2,045 $ 6,548 $ 8,593 0.2%
AA 7,353 13,622 20,975 0.5%
A 7,700 20,112 27,812 0.7%
BBB 3,325 3,325 0.1%
Below investment grade 777 10,839 11,616 0.3%
Total $ 17,875 $ 54,446 $ 72,321 1.8%
CDO type as a percent of total indirect subprime exposure 25% 75% 100%
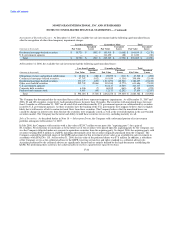
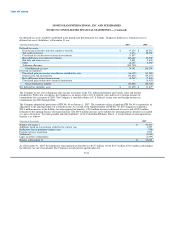
Fair Value Determination: With the disruption of the asset-backed security and credit markets in the second half of 2007, it became
increasingly difficult to obtain verifiable market information for asset-backed securities, including broker-dealer quotes. As a result, the
Company was required to internally value more securities in the second half of 2007. The Company expects this trend to continue for the
foreseeable future; however, the future impact to the Company is limited due to the portfolio realignment in 2008. As described in
Note 18 — Subsequent Events, the Company commenced a process in January 2008 to realign its portfolio away from asset-backed
securities through the sale of securities. If a security was sold during the time that the Company was completing its valuation process for
the investment portfolio as of December 31, 2007, the ultimate sales price for that security was used for valuation purposes as the sales
price was deemed to be the most representative estimate of fair value. Following are the sources of pricing selected by the Company as a
result of its valuation process as of December 31:
2007 2006
(Amounts in thousands) Fair Value Percent Fair Value Percent
Third party pricing service $ 2,203,371 53% $ 3,605,963 63%
Broker pricing 422,612 10% 1,986,502 35%
Internal pricing 87,805 2% 98,135 2%
Sale price 1,473,596 35% — —
Total $ 4,187,384 100% $ 5,690,600 100%
F-25