MoneyGram 2007 Annual Report Download - page 33
Download and view the complete annual report
Please find page 33 of the 2007 MoneyGram annual report below. You can navigate through the pages in the report by either clicking on the pages listed below, or by using the keyword search tool below to find specific information within the annual report.-
 1
1 -
2
-
3
-
4
-
5
-
6
-
7
-
8
-
9
-
10
-
11
-
12
-
13
-
14
-
15
-
16
-
17
-
18
-
19
-
20
-
21
-
22
-
 23
23 -
 24
24 -
 25
25 -
 26
26 -
 27
27 -
 28
28 -
 29
29 -
 30
30 -
 31
31 -
 32
32 -
 33
33 -
 34
34 -
 35
35 -
 36
36 -
 37
37 -
 38
38 -
 39
39 -
 40
40 -
 41
41 -
 42
42 -
 43
43 -
44
-
45
-
46
-
47
-
48
-
49
-
50
-
51
-
52
-
53
-
54
-
55
-
56
-
57
-
58
-
59
-
60
-
61
-
62
-
63
-
64
-
65
-
66
-
67
-
68
-
69
-
70
-
71
-
72
-
73
-
74
-
75
-
76
-
77
-
78
-
79
-
80
-
81
-
82
-
83
-
84
-
85
-
86
-
87
-
88
-
89
-
90
-
91
-
92
-
93
-
94
-
95
-
96
-
97
-
98
-
99
-
100
-
101
-
102
-
103
-
104
-
105
-
106
-
107
-
108
-
109
-
110
-
111
-
112
-
113
-
114
-
115
-
116
-
117
-
118
-
119
-
120
-
121
-
122
-
123
-
124
-
125
-
126
-
127
-
128
-
129
-
130
-
131
-
132
-
133
-
134
-
135
-
136
-
137
-
138
-
139
-
140
-
141
-
142
-
143
-
144
-
145
-
146
-
147
-
148
-
149
-
150
-
151
-
152
-
153
-
154
-
155
-
156
-
157
-
158
-
159
-
160
-
161
-
162
-
163
-
164
 |
 |

Table of Contents
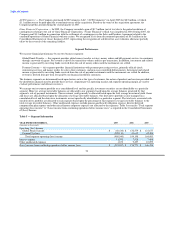
For the year ended December 31, 2006, total revenue and net revenue each grew by 19 percent over 2005 due to 41 percent growth in
money transfer transaction volume. Total expenses, excluding commissions, increased 18 percent over 2005, which reflects additional
headcount to support growth, increased marketing expenditures due to global brand initiatives and higher professional fees to support
technology systems enhancements. These increased expenses were partially offset by lower agent credit losses.
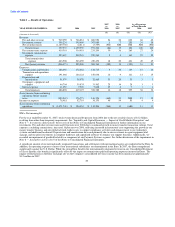
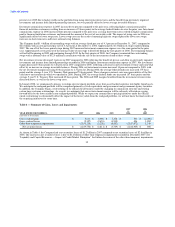
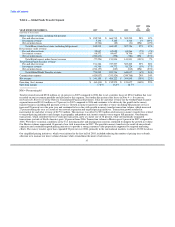
Table 2 — Net Fee Revenue Analysis
2007 2006
vs. vs.
YEAR ENDED DECEMBER 31, 2007 2006 2005 2006 2005
(Amounts in thousands)
Fee and other revenue $ 949,059 $ 766,881 $ 606,956 24% 26%
Fee commissions expense (410,301) (314,418) (231,209) 30% 36%
Net fee revenue $ 538,758 $ 452,463 $ 375,747 19% 20%
Commissions as a % of fee and other revenue 43.2% 41.0% 38.1%
Fee and other revenue consists of fees on money transfer, money orders and official check transactions. For 2007, fee and other revenue
increased by $182.2 million, or 24 percent, from 2006, primarily driven by growth in the money transfer business (including bill payment
services). Growth in money transfer fee and other revenue (including bill payment services) continued to be in line with growth in money
transfer transaction volume, which increased 27 percent during the year as a result of our network expansion and targeted pricing
initiatives. Transaction growth resulted in incremental fee and other revenue of $179.0 million. This transaction growth was offset
slightly by a $9.9 million decrease in money transfer fees resulting from targeted pricing initiatives and changes in geographic and
product mix (money transfer versus urgent bill payment). The change in the Euro exchange rate increased total fee and other revenue by
$21.5 million in 2007 compared to 2006.
Our simplified pricing initiatives, which were initiated in the first half of 2005, included reducing the number of pricing tiers or bands,
allowing us to manage our price-volume dynamic while streamlining the point of sale process for our agents and customers. While
simplified pricing initiatives have contributed to a lower average per transaction fee, we believe that the initiatives have contributed to
our volume growth as simpler pricing and lower overall fees attracts new customers. During 2007, the gap between total revenue growth
and money transfer transaction growth narrowed primarily because we lapped the first year of implementation of simplified pricing
initiatives. Our pricing philosophy continues to be to maintain a price point below our higher priced competitor but above the niche
players in the market. We anticipate money transfer revenue and money transfer volume growth percentages to remain in line, subject to
fluctuations in the Euro exchange rate, pricing initiatives and product mix.
For 2006 and 2005, fee and other revenue was 66 percent and 62 percent of total revenue, respectively. Compared to 2005, fee and other
revenue grew $159.9 million, or 26 percent, in 2006, primarily driven by transaction growth in our money transfer and bill payment
services, with volumes increasing 41 percent during the year. Transaction volume growth in money transfer and bill payment services
increased fee and other revenue by $196.5 million. Average per transaction fees in money transfer and bill payment services were lower
in 2006, reducing fee and other revenue by $56.7 million primarily as a result of our simplified pricing initiative and as a result of shifts
in product and geographic origination mix. Money transfer and bill payment transactions continued to drive fee and other revenue growth
in 2006, while money order transactions, which have higher margins, declined. Our domestic transactions, which contributed lower
revenue per transaction, grew at a faster rate than internationally originated transactions. The gap between total revenue growth and
money transfer transaction growth narrowed in the fourth quarter of 2006 as we began to lap the first year of implementation of
simplified pricing initiatives. The change in the Euro exchange rate increased revenue by $3.2 million compared to 2005.
Fee commissions consist primarily of fees paid to our third-party agents for the money transfer service. We generally do not pay fee
commissions on our money order products. Fee commissions expense grew at a faster pace than fee revenue, increasing $95.9 million, or
30 percent, for 2007 as compared to the prior year, driven by higher money transfer transaction volume, tiered commissions and a
stronger Euro. Higher money transfer transaction volumes increased fee commissions expense by $79.0 million, while higher average
commissions per transaction
30